Republican-leaning states tend to have more traffic deaths
Back in 2014, the U.S. Department of Transportation released a report on the (normalized) number of traffic deaths in each U.S. state. As I looked through the list, I noticed an odd correlation between the political leanings of a state and its traffic fatalities.
To confirm this notion, I used box plots to show the distribution of traffic deaths based on how Republican-leaning each state is, where each dot represents a state.
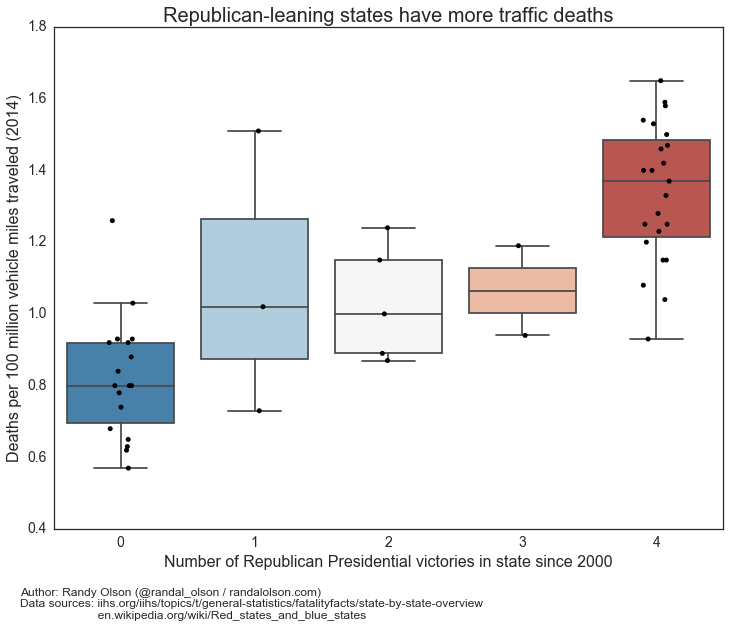
In case you're wondering, Delaware is the Democratic outlier with 1.26 deaths per 100 million miles traveled. Outliers aside, we see an abundantly clear trend: Republican-leaning states tend to have more traffic deaths.
To provide another view, I plotted the same data set as a scatter plot and fit a linear regression below. Each dot represents a state. Again, we see a strong relationship between Republican-leaning states and more traffic deaths.
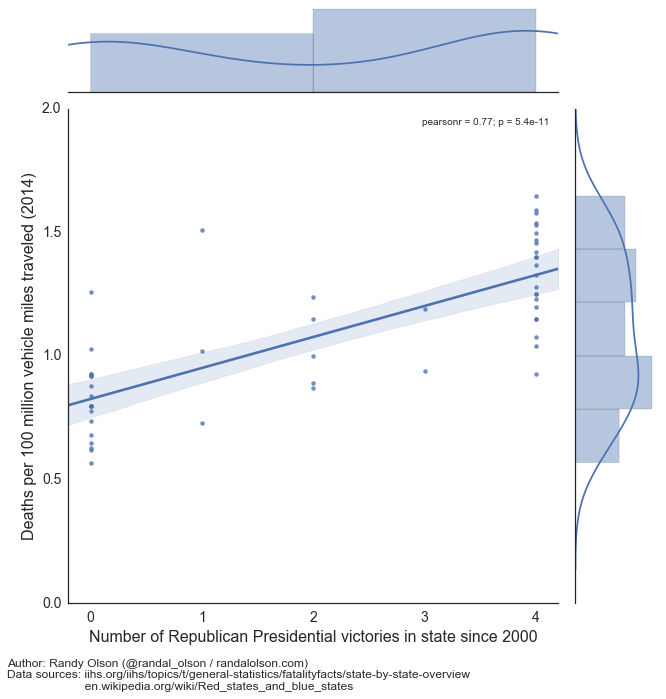
At this point, I feel obligated to make the caveat that these charts only establish a correlation, and it doesn't mean that residents of Republican-leaning states experience higher traffic deaths because they tend to vote Republican. However, it sure makes for an interesting statistic to ponder: why would there be a correlation between traffic death rate and tendency to vote Republican?
Thanks to David Fairlie for sharing these interesting statistics on /r/DataIsBeautiful.

Dr. Randal S. Olson
AI Researcher & Builder · Co-Founder & CTO at Goodeye Labs
I turn ambitious AI ideas into business wins, bridging the gap between technical promise and real-world impact.