How Americans make a living based on their age
Published on March 06, 2018 by Dr. Randal S. Olson
data visualization employment united states usa visualization
2 min READ
As I discussed in my last post, certain industries in the U.S. draw a younger (or older) demographic than others. There are a variety of reasons that younger people are more likely to work in a shoe store than a funeral home, but I'm not going to touch on that here. Instead, in this post I want to provide a more detailed view of the U.S. Bureau of Labor Statistics employment data. In the chart below, I plotted employment in the 13 high-level industries tracked by the BLS as a function of age groups ranging from 16-19 to 65+.
To read this chart, start with the x-axis, which shows the age groups tracked by the BLS in order. The y-axis shows the percent of Americans in that age group who are employed in each industry. Lastly, the color of the lines indicate the industry, which are listed on the side of the cart. For example, the light blue line sitting at 25% for the 16-19 age group indicates that 25% of 16-19 year olds work in the "Wholesale and retail trade." You can follow that light blue line to see how different age groups move in or out of that industry.
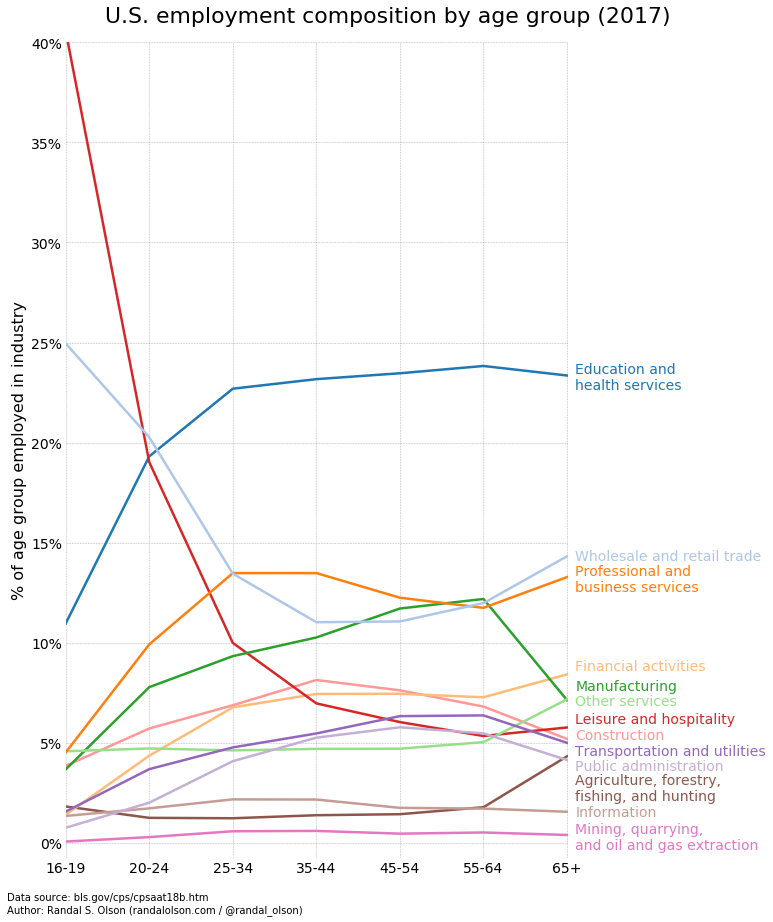
Perhaps the most noticeable data point on this chart is that roughly 40% of all employed 16-19 year olds work in the leisure and hospitality industry, primarily in the food service industry. The leisure and hospitality industry quickly loses popularity with 20+ year olds, and constitutes less than 10% of the jobs that 30+ year olds hold.
Some other notables:
- The wholesale and retail trades are similarly popular among 16-19 year olds but less so among 20+ year olds. However, it seems to resurge in popularity among 55+ year olds, possibly due to retirement from other professions.
- Manufacturing jobs see a major drop among 65+ year olds, likely due to retirement from those physically demanding jobs. Construction jobs follow a similar a similar path.
- Education and health service as well as professional and business service jobs grow in popularity as workers grow older, likely due to the educational and experience requirements of those jobs. Both industries seem fairly resilient to retirement age, unlike manufacturing and construction.
You can download the dataset as a CSV file here if you'd like to work with it yourself.