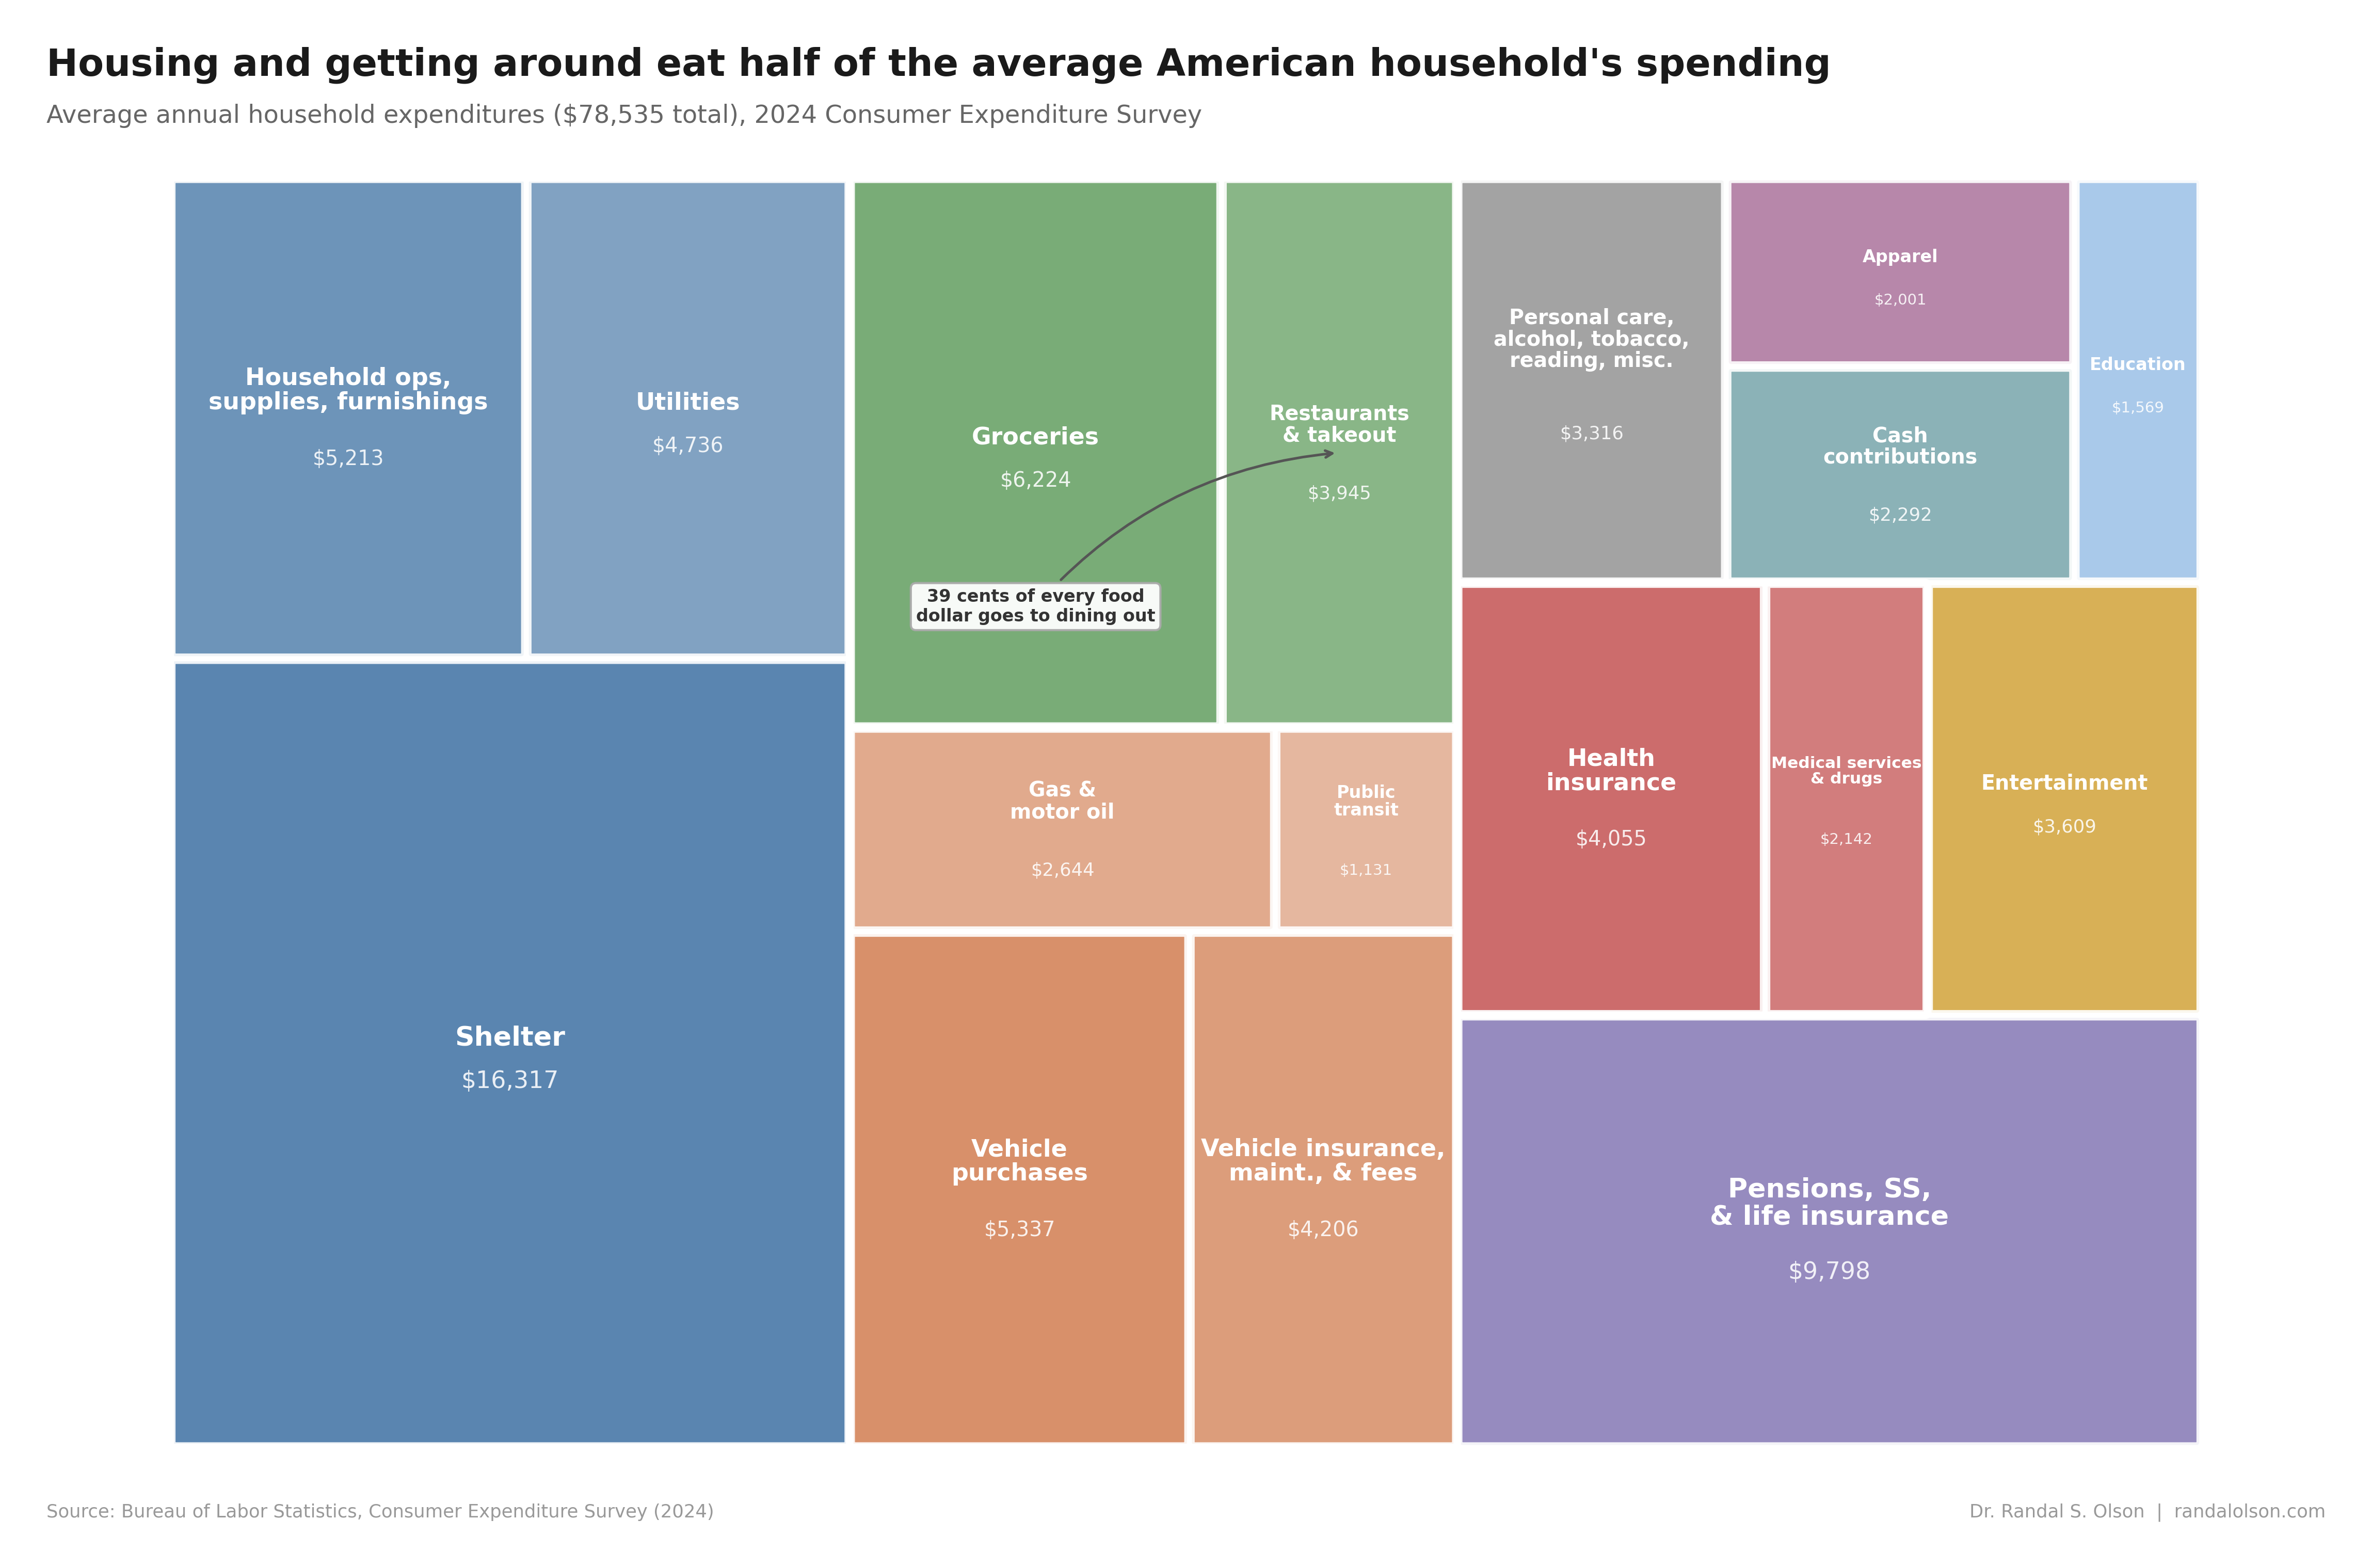
Housing and getting around eat half of the average American household's spending
Part of Teaching an AI Agent to Make Beautiful Charts
Every year the Bureau of Labor Statistics asks thousands of American households exactly where their money goes. The 2024 Consumer Expenditure Survey came out in December 2025 and puts average annual household spending at $78,535. I mapped every dollar.
One in three dollars goes to keeping a roof overhead
Housing runs $26,266 per year, a full third of the average household budget. Shelter (rent, mortgage, property tax) alone is $16,317 of that. Nobody who has tried to rent or buy in the last five years needs to be told this. Median gross rent hit $1,487 per month in 2024, up 36% from $1,097 in 2019, based on the ACS 1-year estimates for 2019 and 2024. Median household income rose from $65,712 to $81,604 over the same stretch, a 24% increase.
The root cause is a supply shortage. Since 2000, housing construction has fallen 3 to 6 million units behind demand from population growth and an aging population forming more households. Home insurance premiums have jumped 57% since 2019 on top of that.
Getting around costs more than eating
Transportation is $13,318 per year, 31% more than the $10,169 spent on food. Vehicle purchases ($5,337) and insurance, maintenance, and fees ($4,206) are the big line items. Gas is actually a smaller slice at $2,644. For lower-income households, the burden is even worse: the Bureau of Transportation Statistics found they spend up to 32% of pre-tax income just getting to work.
Most American cities were built around cars, and the average household doesn't have much choice but to own and maintain at least one.
Dining out is closing in on groceries
Americans now spend 39 cents of every food dollar at restaurants or ordering delivery. Eating out cost $3,945 in 2024, compared to $6,224 on groceries. That gap keeps narrowing: since 2010, restaurant and takeout spending has grown at about 7% annually, nearly double the 4% growth rate for groceries. Food delivery spending has grown 924% since 1997, crossing $100 billion for the first time in 2024.
DoorDash, Uber Eats, and their competitors have made ordering a meal almost as easy as opening the fridge. If those growth rates hold, dining out will match grocery spending by around 2040.
2.3 times more on entertainment than education
Entertainment: $3,609. Education: $1,569. That gap looks stark, but the education number only captures what households pay directly for tuition, fees, and supplies. Employer tuition benefits, state university subsidies, and federal financial aid all reduce the out-of-pocket figure. Entertainment, meanwhile, covers everything from streaming subscriptions and pet care to concert tickets and gym memberships.
Healthcare looks smaller here because this chart only counts what households pay directly
The $6,197 healthcare total in this chart is household spending, not total healthcare spending on a household's behalf. In the BLS data, that breaks into $4,055 for health insurance and $2,142 for medical services, drugs, and supplies. KFF's 2024 Employer Health Benefits Survey found average employer-sponsored family coverage cost $25,572, with workers contributing $6,296 toward that total. For households with employer coverage, most of the premium is paid outside this chart.
National health spending hit nearly $5.3 trillion in 2024, growing 7.2% in a single year.
How this chart was made
An AI agent built this chart end-to-end as part of the Beautiful Charts with AI series. It pulled the latest BLS data, built a treemap in Python, and iterated on the design until it passed the Tufte Test, a data visualization quality standard built by Goodeye Labs on Truesight.
Data source: Bureau of Labor Statistics, Consumer Expenditure Survey (2024). The cleaned dataset is available here.
Beautiful Charts with AI
Want to test your own charts against the same quality bar?
Try the Tufte Test on your own chart, or get future updates on AI evaluation and chart quality from Goodeye Labs.

Dr. Randal S. Olson
AI Researcher & Builder · Co-Founder & CTO at Goodeye Labs
I turn ambitious AI ideas into business wins, bridging the gap between technical promise and real-world impact.