Coal collapsed and natural gas took over the U.S. power grid
Part of Teaching an AI Agent to Make Beautiful Charts
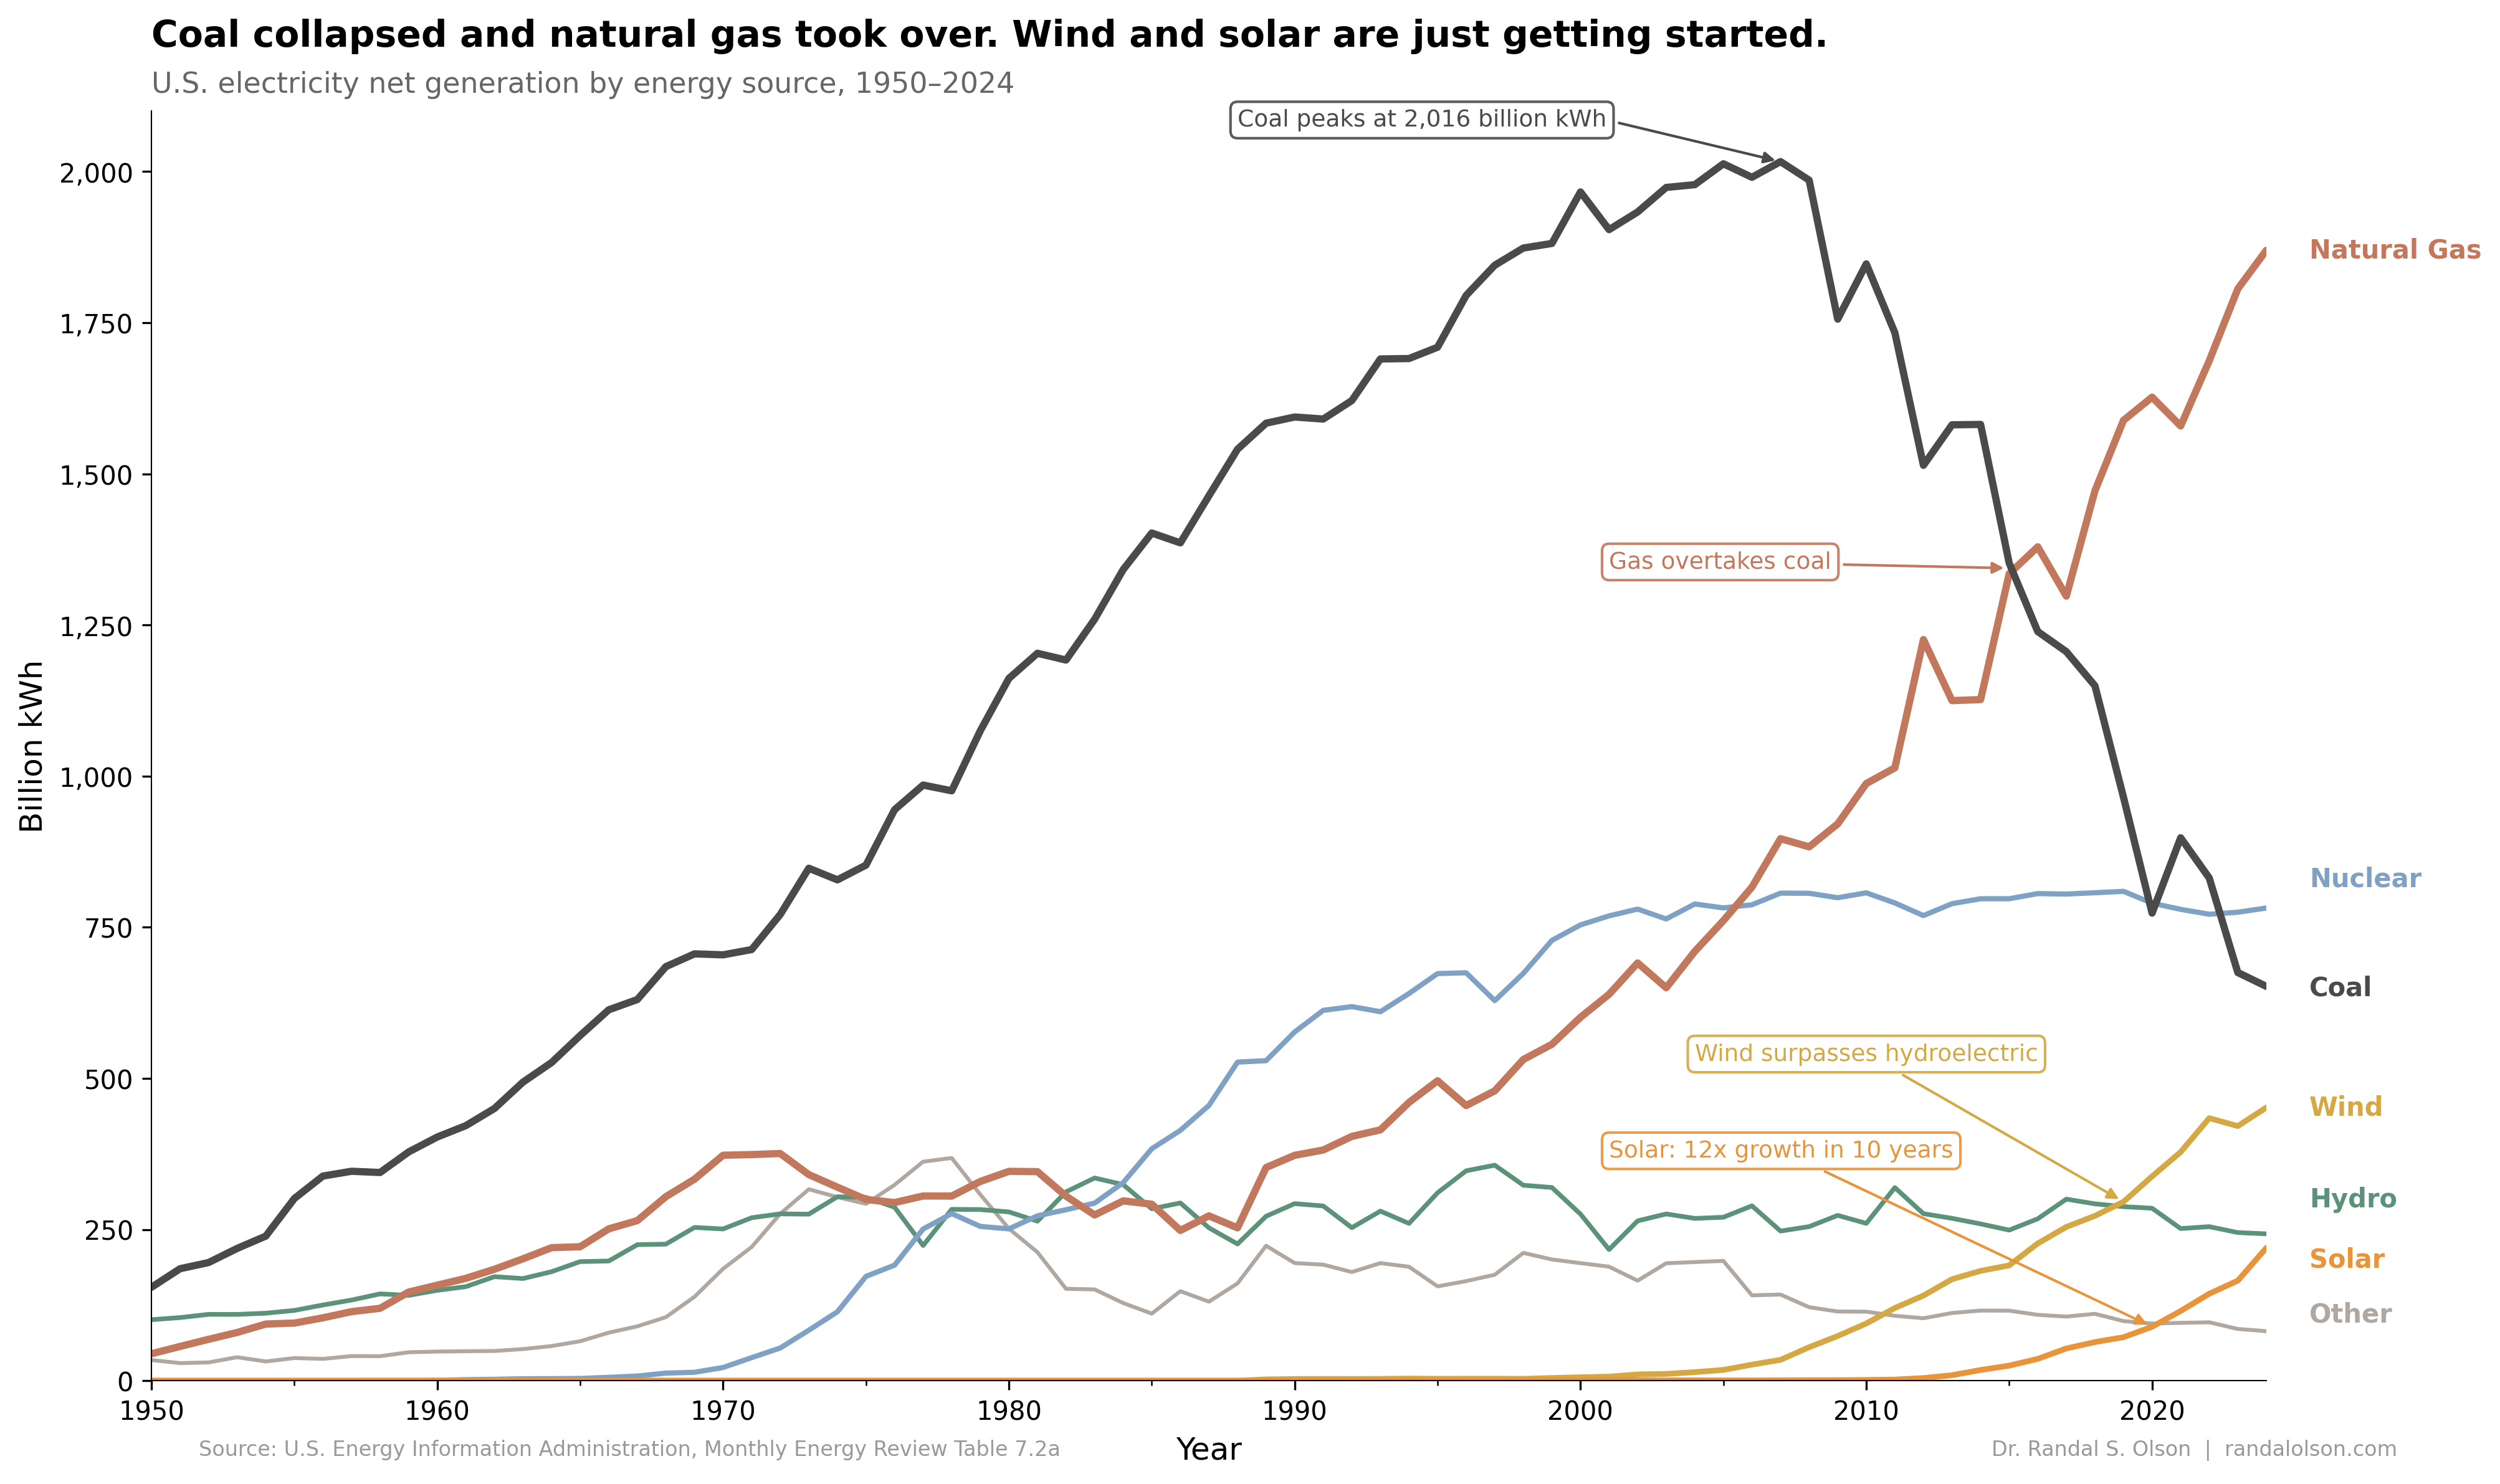
The U.S. generates 13 times more electricity today than it did in 1950. But the bigger story isn't how much we generate. It's where that electricity comes from. I grabbed 75 years of data from the EIA's Monthly Energy Review and pointed an AI agent at it to chart the shifts.
Coal's collapse
Coal went from generating 52% of U.S. electricity in 2000 to just 15% by 2024. It peaked in 2007 at 2,016 billion kWh, then lost two-thirds of its output in less than two decades. U.S. coal capacity peaked at 317.6 GW in 2011; by the end of 2026, half of that capacity will be gone.
The shale gas takeover
Natural gas filled the gap. Gas tripled its output from 601 billion kWh in 2000 to 1,870 billion kWh in 2024, now generating 43% of U.S. electricity. The mechanism was price: hydraulic fracturing flooded the market with cheap shale gas, and Henry Hub spot prices crashed from $8.88/MMBtu in 2008 to $2.77 by 2012. Utilities retired coal plants and built gas turbines. Gas overtook coal in 2016.
Nuclear holds steady
Nuclear has hovered between 770 and 810 billion kWh annually for the past two decades, sitting at about 18% of U.S. electricity. The first commercial reactors came online in the late 1950s, and nuclear grew fast through the 1970s and 80s.
Three Mile Island in 1979 and rising construction costs froze new builds, but the existing fleet keeps running. Its carbon-free output is still larger than wind and solar combined.
Here's where it gets interesting: Microsoft signed a 20-year deal in 2024 to restart TMI's Unit 1 to feed its AI data centers. The plant that froze nuclear construction for a generation is being brought back online because the grid can't build new capacity fast enough.
Wind and solar's breakout decade
Wind was 18 billion kWh in 2005. By 2024, wind hit 452 billion kWh (10.5%) and utility-scale solar reached 220 billion kWh (5.1%), combining for 15.6% of the grid. Wind's growth owes a lot to the federal production tax credit, first enacted in 1992 when the U.S. had less than 1.5 GW of wind capacity. Solar grew 12x in a single decade, from 18 billion kWh in 2014 to 220 billion kWh in 2024. (These solar figures cover utility-scale installations only. Including rooftop solar pushes the 2024 total closer to 304 billion kWh.)
Renewables as a whole (wind, solar, hydro, geothermal, biomass) generated 976 billion kWh in 2024, making up 22.7% of total generation. That's more than coal and more than nuclear.
How this chart was made
An AI agent built this chart end-to-end as part of the Beautiful Charts with AI series. It pulled the latest EIA data, built the chart in Python, and iterated on the design until it passed the Tufte Test, a data visualization quality standard built by Goodeye Labs on Truesight.
Data source: U.S. Energy Information Administration, Monthly Energy Review Table 7.2a. The cleaned dataset is available here.
Tags
Related Posts

Dr. Randal S. Olson
AI Researcher & Builder · Co-Founder & CTO at Goodeye Labs
I turn ambitious AI ideas into business wins, bridging the gap between technical promise and real-world impact.