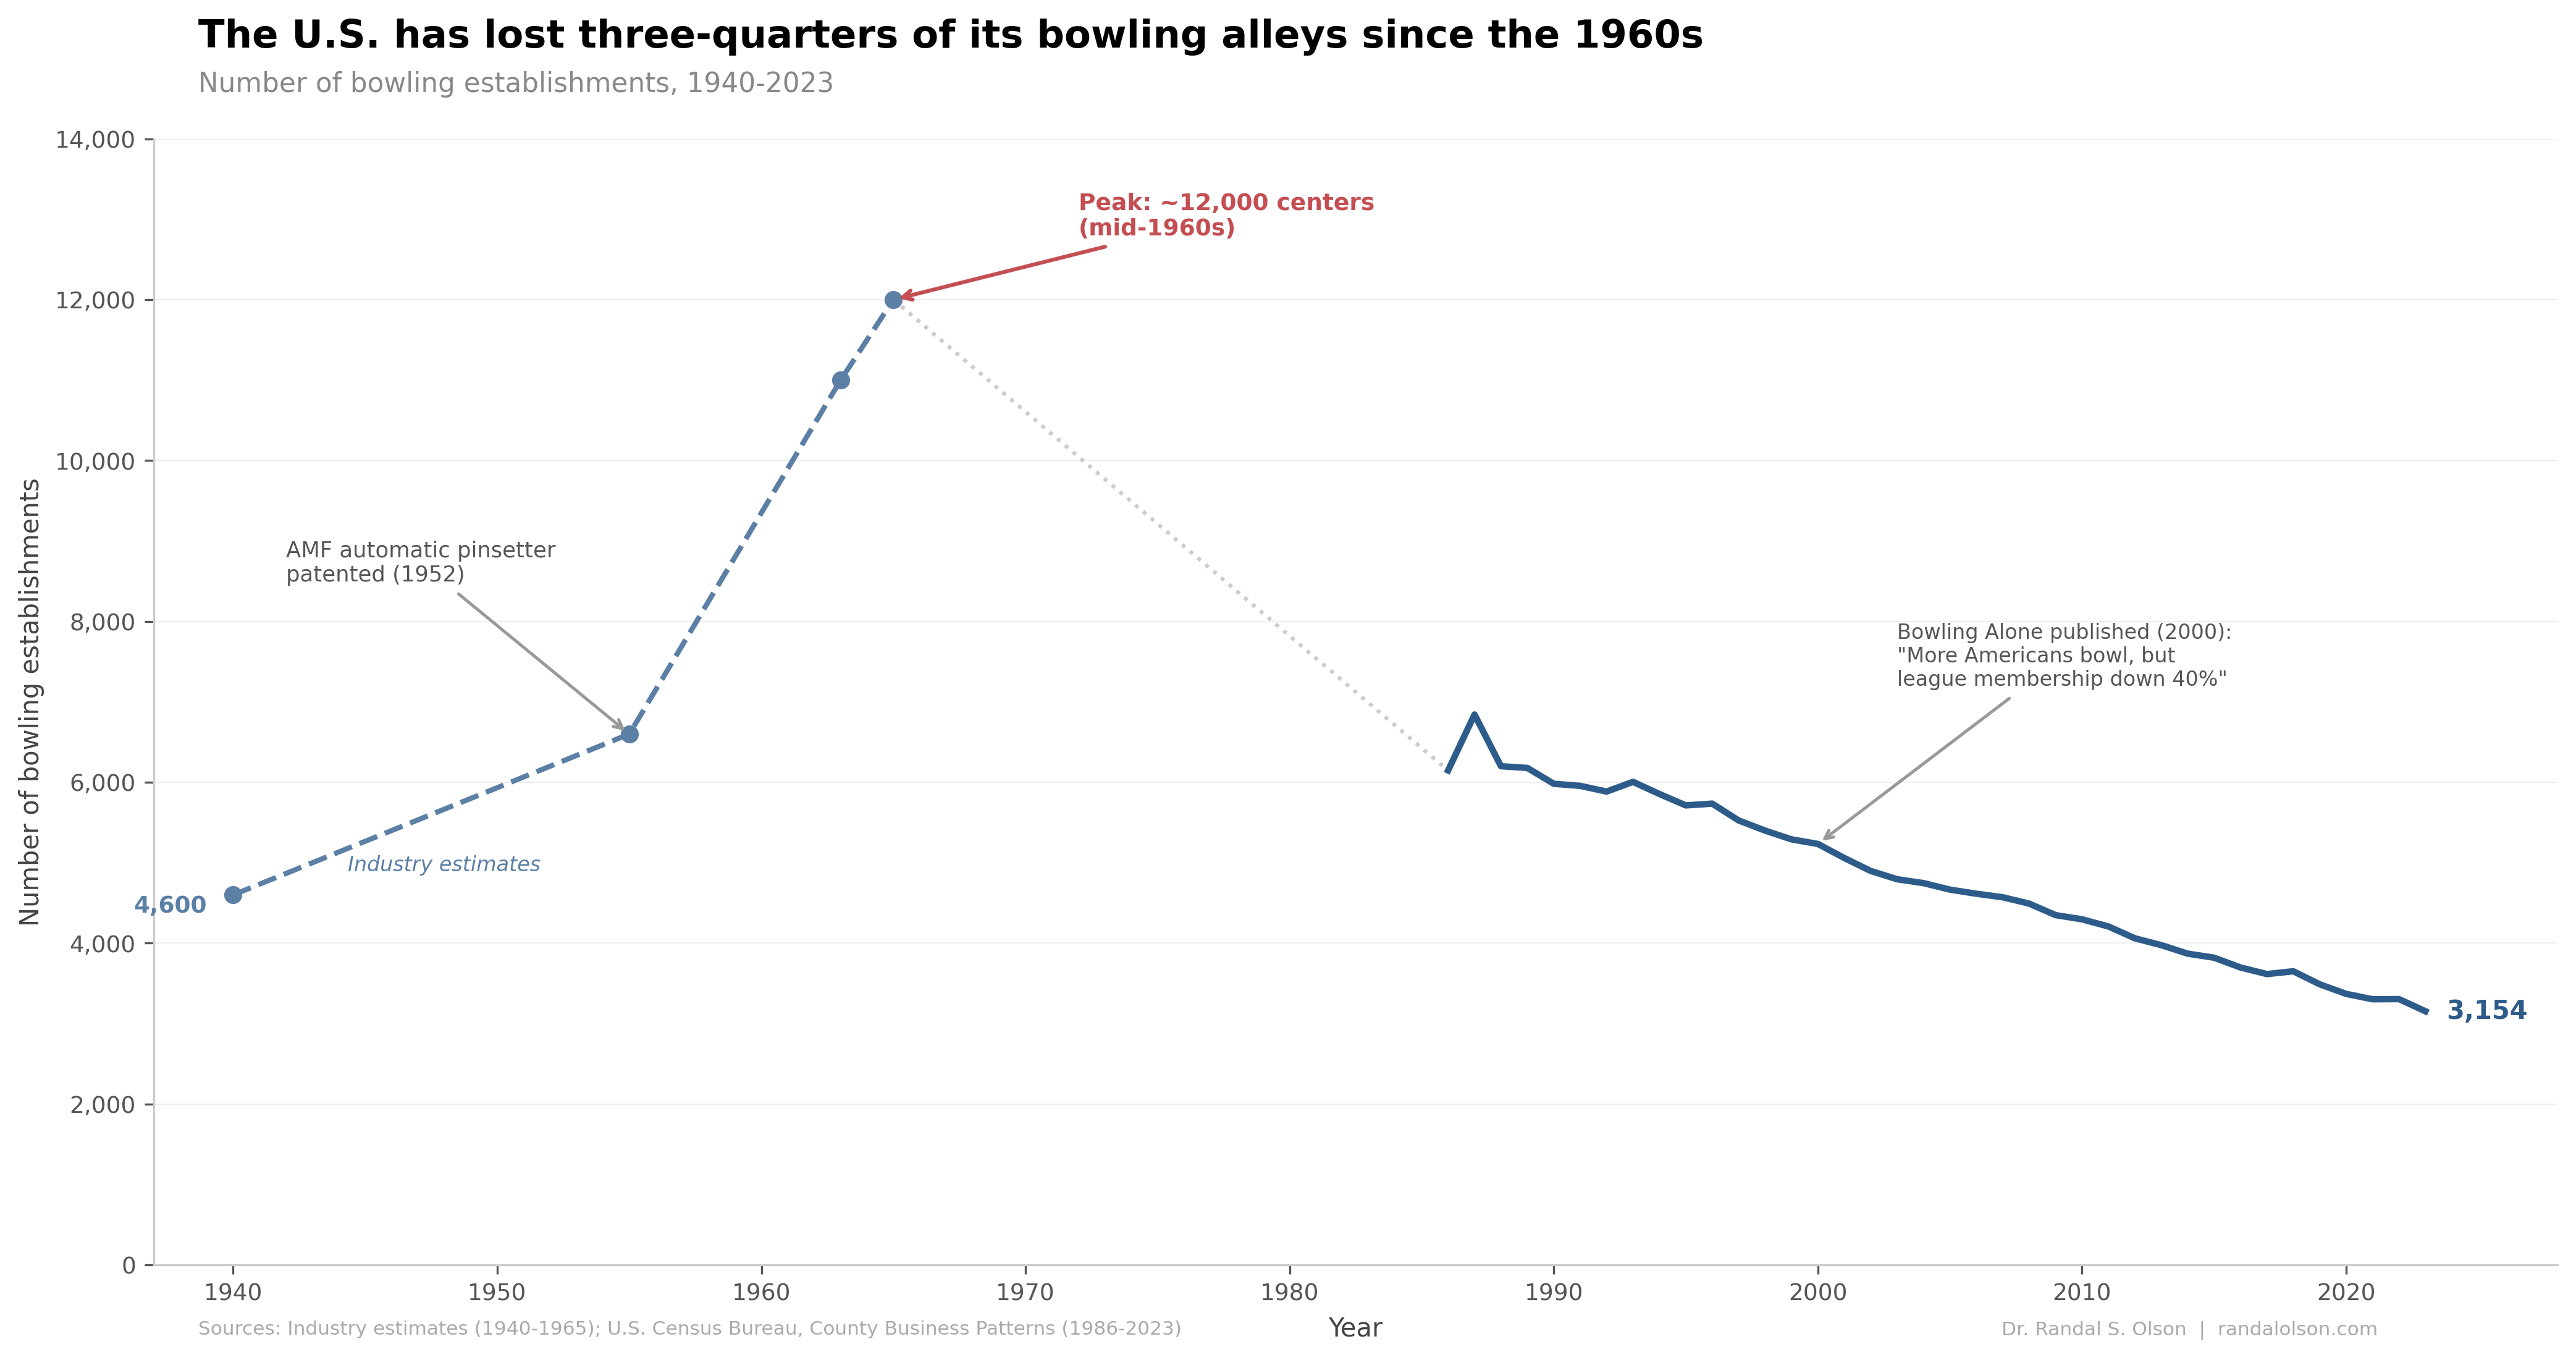
The rise and fall of bowling in the United States
Part of Teaching an AI Agent to Make Beautiful Charts
In the mid-1960s, there were roughly 12,000 bowling alleys scattered across the United States. Today, fewer than 3,200 remain. The chart below traces that entire arc, from the post-war bowling boom through six decades of steady decline.
The machine that made bowling boom
Before the 1950s, bowling alleys relied on "pin boys" to manually reset pins after each throw. The job was dangerous and unreliable. In 1946, AMF unveiled its Automatic Pinspotter at the American Bowling Congress tournament in Buffalo, NY. By 1952 the machines were in commercial production, and they transformed the sport almost overnight.
The number of bowling centers nearly doubled in under a decade, jumping from around 6,600 in 1955 to 11,000 by 1963. Automation made bowling quieter and more family-friendly. New alleys popped up in the suburbs with big parking lots and cocktail lounges, earning the nickname "the poor man's country club." Meanwhile, ABC's Pro Bowlers Tour debuted in 1962 and drew 12-14 million weekly viewers at its peak, routinely outdrawing college football.
The long decline
The boom didn't last. By the late 1970s, league bowling membership had peaked at 9.8 million and began falling. Between 1980 and 1993, league bowling dropped by 40%. Women entering the workforce had less time for weekly league nights. Cable TV exploded the number of sports options competing for attention. Video games, and later the internet, siphoned away the casual recreation dollars that bowling depended on.
The real estate math stopped working, too. A bowling alley sits on 20,000 to 40,000 square feet of prime commercial land. As property values climbed, landlords and developers found more profitable uses for those footprints. The industry's own analysts noted that bowling leaders "were misreading the membership and interest trends during the 1980s and did very little to pump new life into a slumping industry."
Bowling alone
In 2000, Harvard political scientist Robert Putnam made bowling the central metaphor in his book Bowling Alone. His core observation: the total number of Americans who bowled increased by 10% between 1980 and 1998, but league bowling fell by 40%. People were still showing up to bowl. They just weren't joining leagues to do it.
Putnam argued that the decline of league bowling was part of a collapse in American civic life. Drawing on nearly 500,000 interviews, he showed that Americans were signing fewer petitions, joining fewer organizations, knowing their neighbors less, and socializing with their own families less often. The share of Americans who believed "most people can be trusted" fell from 55% in 1960 to roughly 35% by the late 1990s. Bowling was the canary in the coal mine. Critics later argued that civic life was shifting forms rather than disappearing, but the bowling numbers themselves were hard to dispute.
What 3,154 bowling alleys look like
The Census Bureau counted 3,154 bowling establishments with paid employees in 2023, down from 6,148 in 1986, the first year of consistent federal data. That's a 49% decline in under four decades, on top of the roughly 50% decline that had already occurred between the mid-1960s peak and 1986.
The surviving industry looks nothing like the one that peaked in the 1960s. Companies like Bowlero (now rebranded as Lucky Strike Entertainment) have pushed upscale: cocktail bars, gourmet food, cosmic bowling with blacklights and thumping music. Food and beverage now accounts for 35-45% of a modern bowling center's revenue, up from a small fraction in the league era. The reinvention has slowed the bleeding, but it hasn't stopped it. The decline rate in 2019-2023 (-2.5% per year) is virtually identical to 2015-2019 (-2.2% per year).
How this chart was made
An AI agent built this chart end-to-end as part of the Beautiful Charts with AI series. It researched and compiled the data, built the chart in Python, and iterated on the design until it passed the Tufte Test, a data visualization quality standard built by Goodeye Labs on Truesight.
Data sources: Industry estimates for 1940-1965 compiled from the Smithsonian, Reference for Business, and other historical sources. Federal data for 1986-2023 from the U.S. Census Bureau, County Business Patterns (NAICS 713950 / SIC 7933). The full dataset is available here.
Beautiful Charts with AI
Want to test your own charts against the same quality bar?
Try the Tufte Test on your own chart, or get future updates on AI evaluation and chart quality from Goodeye Labs.

Dr. Randal S. Olson
AI Researcher & Builder · Co-Founder & CTO at Goodeye Labs
I turn ambitious AI ideas into business wins, bridging the gap between technical promise and real-world impact.