Libraries were transforming. Then COVID hit.
Part of Teaching an AI Agent to Make Beautiful Charts
Everyone keeps saying public libraries are dying. I pulled 24 years of federal survey data to find out, and the picture is more complicated than the headlines suggest. Libraries were in the middle of a transformation when COVID interrupted it.
The recession filled the libraries
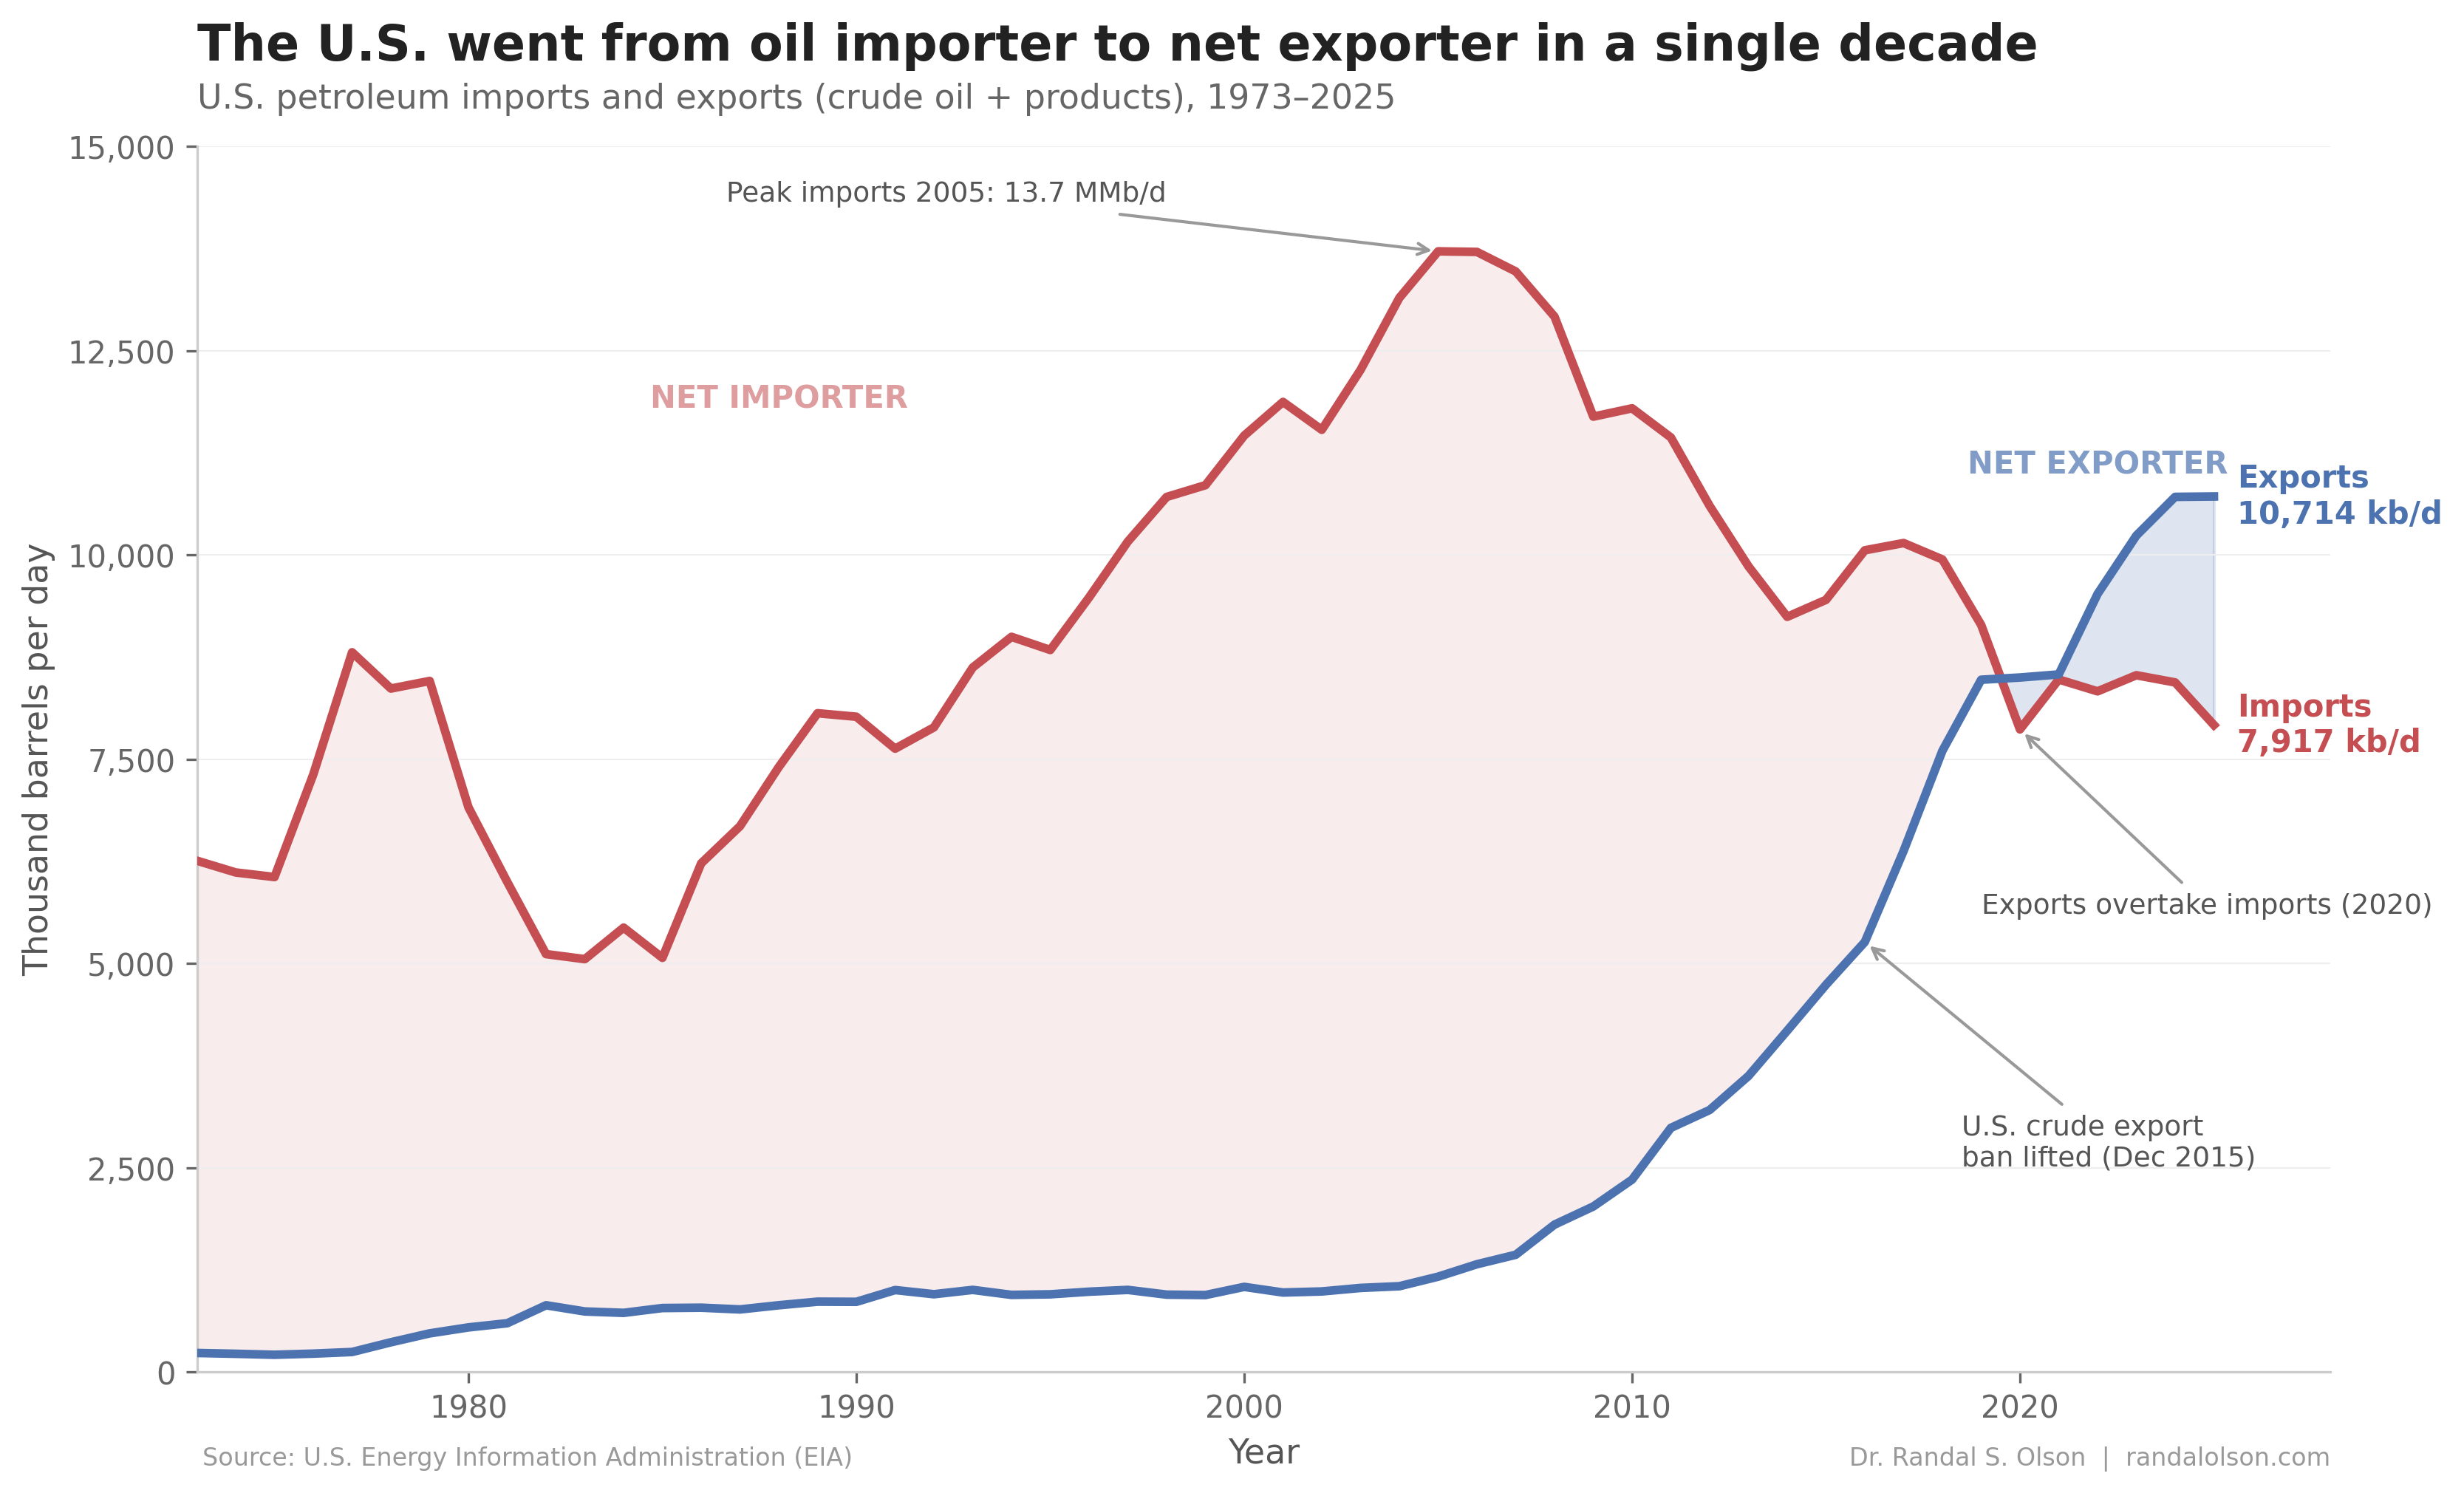
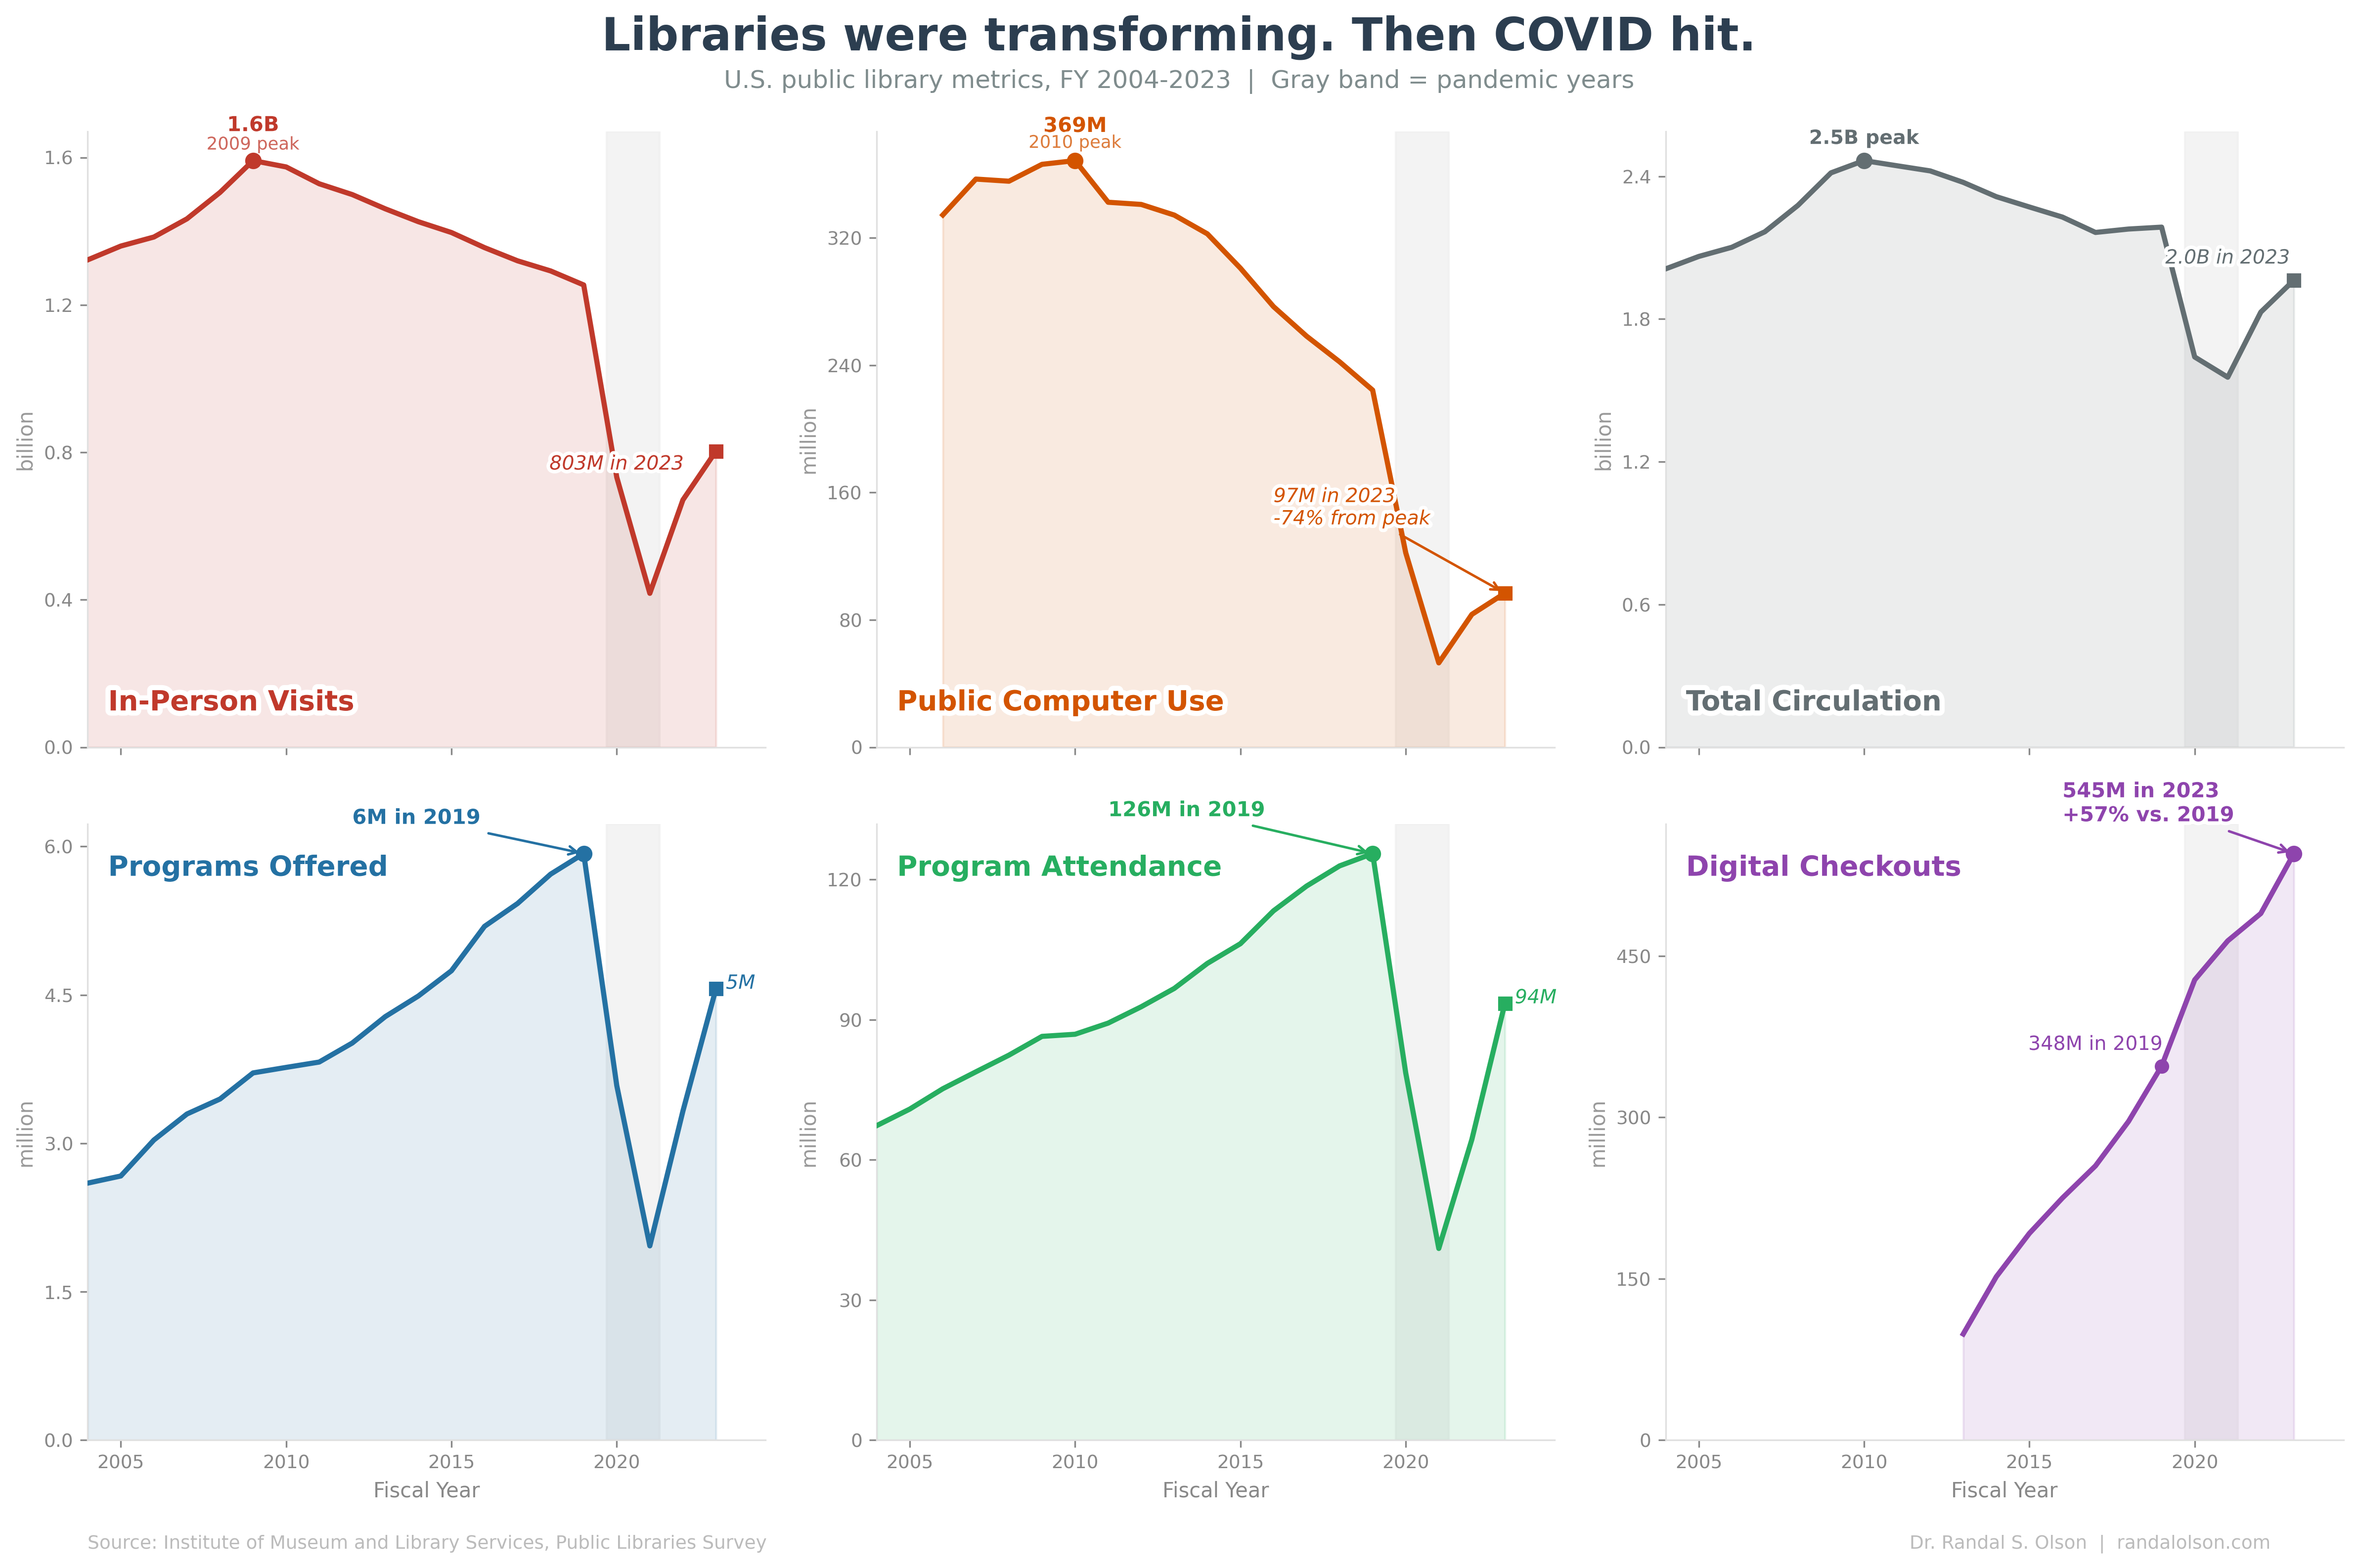
In-person visits peaked at 1.6 billion in 2009, right in the teeth of the Great Recession. Libraries became lifelines: free internet, resume workshops, foreclosure seminars. CNN reported at the time that the Buffalo/Erie County system saw computer use jump 50% as unemployed workers flooded in to search for jobs.
Then visits started falling and never stopped. By 2019, before anyone had heard of COVID, annual visits were already down 21% from that recession peak. Smartphone ownership crossed 50% in 2013 and now sits at 90%. You no longer need to visit a building to get online.
The computer lab emptied out
Public computer use peaked at 369 million sessions in 2010, then fell 74% to just 97 million by 2023. No metric on this chart declined more steeply. In Connecticut, library computer sessions dropped from nearly 6 million in 2006 to under 1 million by 2022.
The decline started well before the pandemic. Every year from 2010 onward, fewer people used a library computer than the year before. Smartphones didn't just compete with library terminals; they made them obsolete for most of the population.
But libraries were reinventing themselves
Even as foot traffic fell, libraries nearly doubled their programming between 2006 and 2019, growing from 3 million programs to 5.9 million. Program attendance grew 67% over the same period, from 75 million to 126 million. Libraries were trading visitors for participants.
This was a deliberate strategy. As fewer people needed libraries for books or internet access, libraries started offering STEM makerspaces, coding classes, 3D printing labs, and job training. By FY 2017, over 118 million people attended library programs annually. The transformation was working.
COVID set it all back
The pandemic demolished the new model along with the old one. Programs offered fell 40% in 2020, from 5.9 million to 3.6 million, then bottomed out at 2.0 million in 2021. Attendance followed the same path, from 126 million down to 79 million and then to 41 million. More than a decade of programming gains were erased in two years.
By 2023, programs had recovered to 4.6 million and attendance to 94 million. That's a strong rebound, but both are still well below where they were in 2019. The transformation trajectory that was building for over a decade is now rebuilding from a lower baseline.
Digital is the one bright spot
Digital checkouts are the only metric on this chart above pre-pandemic levels, up 57% since 2019. OverDrive alone reported 662 million digital checkouts in 2023, and that number jumped another 17% to 739 million in 2024.
When library buildings closed in 2020, digital checkouts jumped 23% in a single year and have kept climbing every year since. Turns out that once people discover they can borrow ebooks and audiobooks from their couch, most of them keep doing it.
The buildings are still there
The number of U.S. public library outlets has held steady at roughly 17,000 for over two decades. Despite every trend on this chart, communities aren't closing their libraries. The open question is whether the programming rebound continues, or whether the pandemic permanently lowered the ceiling.
Federal IMLS funding is being cut, and at $266.7 million (75 cents per American), it wasn't exactly generous to begin with.
How this chart was made
An AI agent built this chart end-to-end as part of the Beautiful Charts with AI series. It downloaded 24 years of IMLS survey data, aggregated national totals, and iterated on the design until it passed the Tufte Test, a data visualization quality standard from Goodeye Labs. The workflow behind it is public: run the same high-signal chart workflow to make your own.
Data source: Institute of Museum and Library Services, Public Libraries Survey, FY 2000-2023. The aggregated dataset is available here.
Beautiful Charts with AI
Make your own charts with the same workflow
Every chart in this series is built by the same public workflow. Fork it and run it yourself, then grade the result against the Tufte Test.

Dr. Randal S. Olson
AI Researcher & Builder · Co-Founder & CTO at Goodeye Labs
I’ve worked in AI for 15+ years. At Goodeye Labs, we build AI products that point frontier models at the business outcomes a team actually cares about.