U.S. birth rate fell to a record low in 2025
Part of Teaching an AI Agent to Make Beautiful Charts
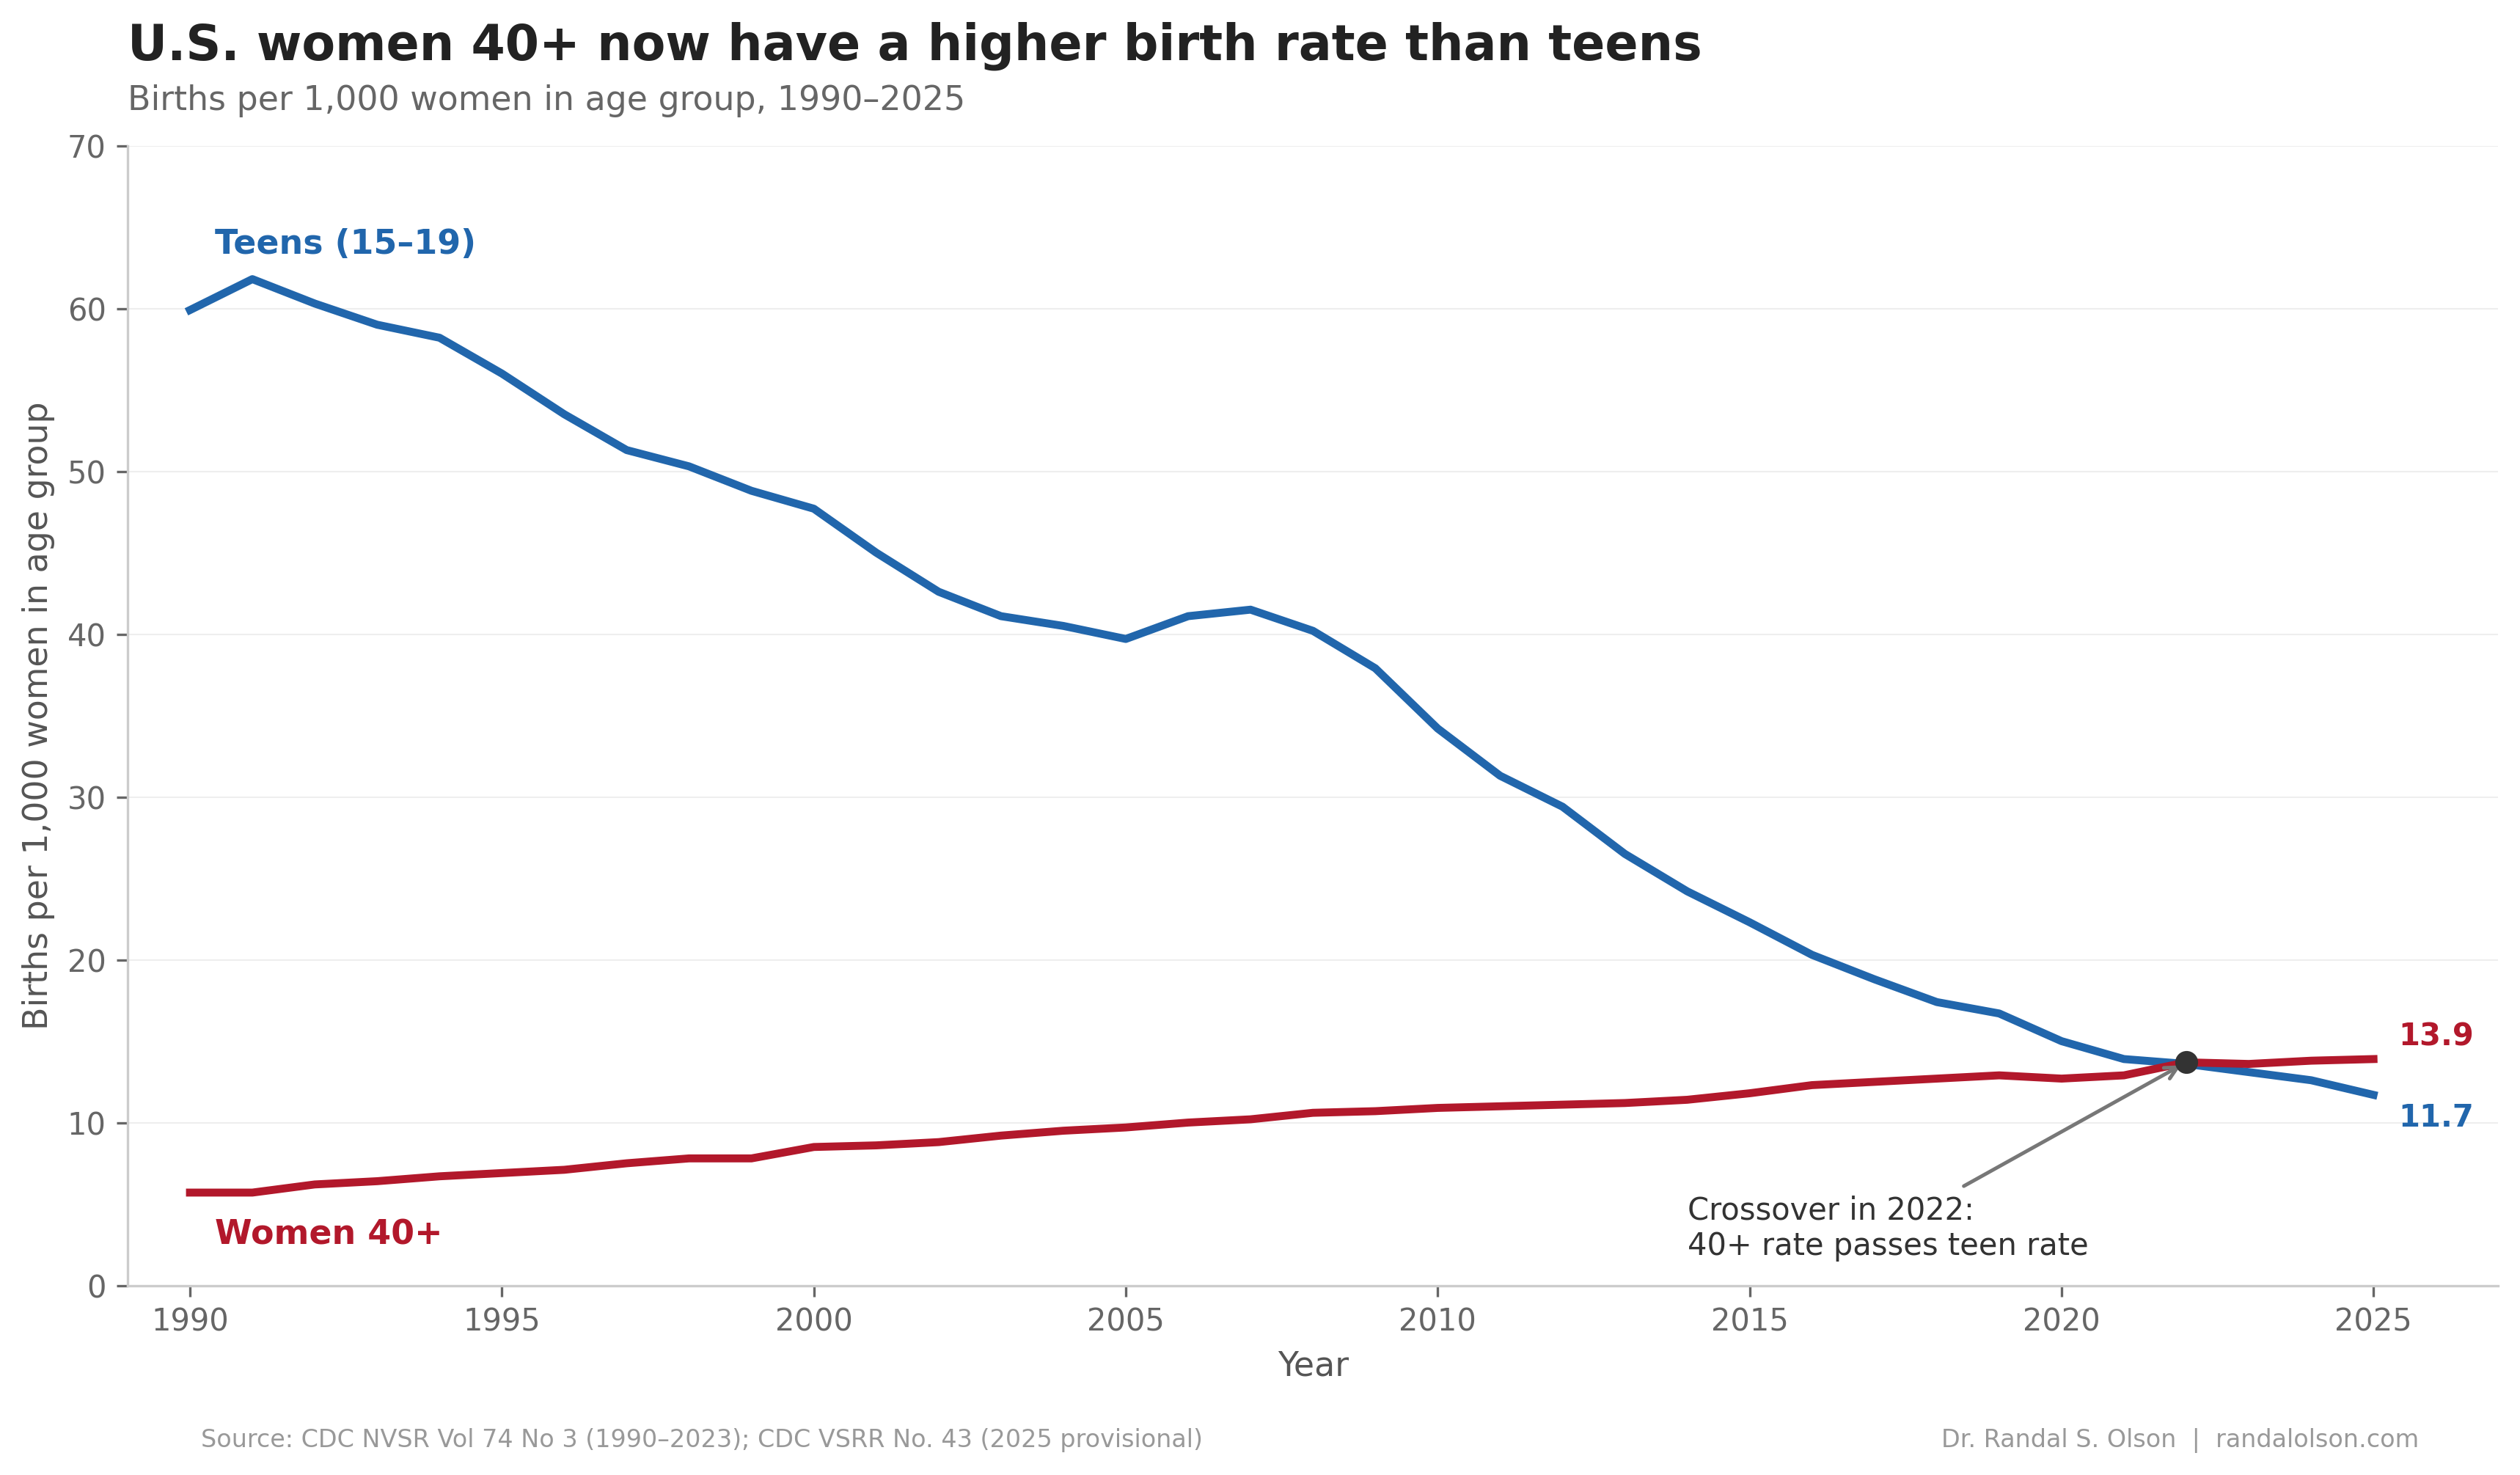
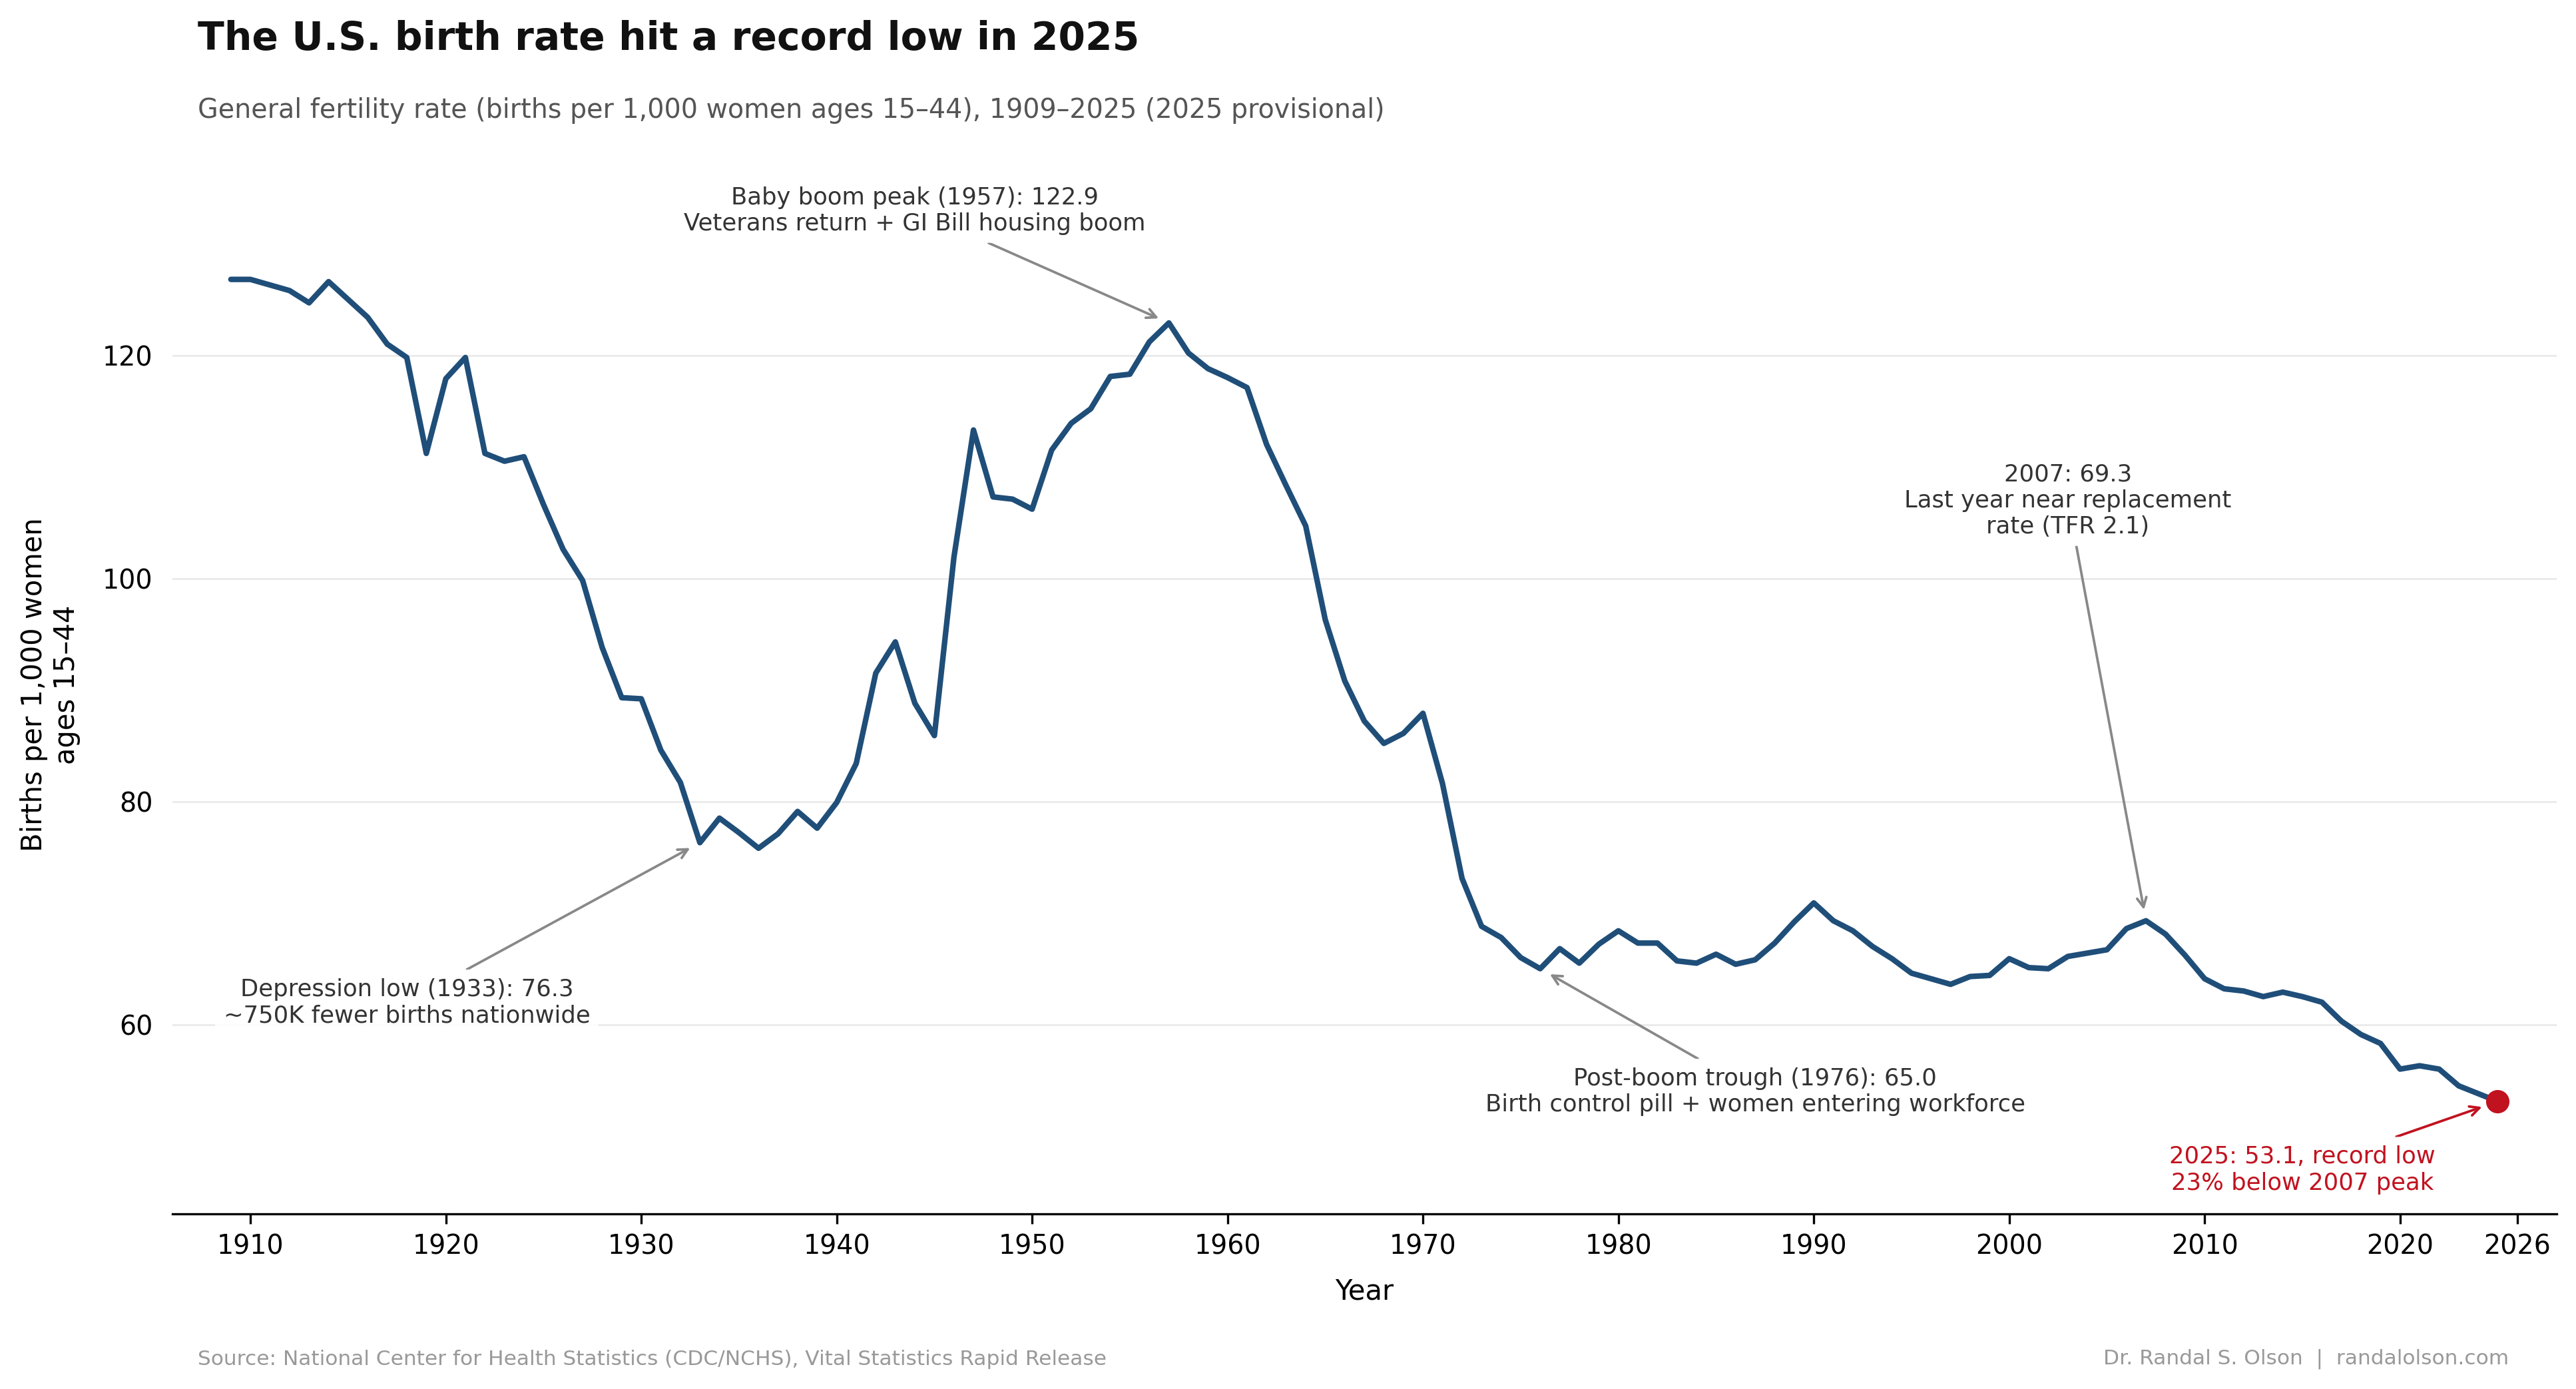
On April 9, 2026, the CDC released provisional birth statistics for 2025. The general fertility rate, which measures births per 1,000 women ages 15 to 44, came in at 53.1. That is lower than any year in the dataset going back to 1909, and 23% below the 2007 peak of 69.3. The chart below puts 116 years of that decline in context.
Birth rates were already falling when the Depression hit
The 1909 rate of 126.8 was not a peak. Births per woman had been declining through the late 1800s as the U.S. shifted from a rural farming economy, where children were a labor asset, to an urban industrial one, where they were an expense. By 1929, the rate had already fallen to about 89.
The Depression then cratered it further. Research published in the Journal of Demographic Economics estimated the economic hardship of the 1930s produced roughly 750,000 fewer births nationwide, driven by delayed marriages and a steep drop in marital fertility rates. The rate hit 76.3 in 1933 before slowly recovering through the late 1930s.
Returning soldiers triggered the baby boom
The GFR climbed steadily from 1940 through 1957, peaking at 122.9. The causes were straightforward: 16 million service members came home after World War II, many of them in their prime childbearing years, and the GI Bill gave them access to low-interest home loans, college tuition, and unemployment benefits. Economic security and deferred family plans collided at the same moment.
At the 1957 peak, a baby was born in the U.S. roughly every 7 seconds. The baby boom is often remembered as a new baseline for U.S. family size, but the chart makes clear it was a temporary interruption of a longer downward trend, not a permanent reset.
The birth control pill drove the post-boom collapse
The FDA approved oral contraceptives in 1960. Rates dropped quickly through the 1960s. The 1965 Supreme Court ruling in Griswold v. Connecticut made contraception legal for married couples; Eisenstadt v. Baird extended the same right to unmarried couples in 1972. Women entered the workforce in larger numbers, and average family size shrank.
By 1976, the GFR had fallen to 65.0, nearly half the baby boom peak. Rates then stabilized through the 1980s and 1990s, lifted partly by the echo boom as baby boomers' own children reached childbearing age. By 2007, the rate had edged back up to 69.3, briefly bringing the total fertility rate near the 2.1 replacement level for the first time since the early 1970s.
The 2007 decline never turned around
The Great Recession hit in 2008, and birth rates fell with it. That part is predictable. What is less predictable is that they kept falling after the recession ended. A 2022 analysis in the Journal of Economic Perspectives called it a puzzle: researchers could not identify any single economic, policy, or social shift after 2007 that explained the continued decline. Student debt, housing costs, and childcare prices each correlated loosely with birth rates in some states but not others, and none could explain a decline that cut across income levels and education groups.
The leading explanation is a shift in preferences, particularly among younger cohorts who report lower desired family sizes than their predecessors did at the same age. The 2025 rate of 53.1 is 23% below 2007 and lower than any year in the CDC's dataset, according to the provisional CDC report.
What the numbers mean going forward
A general fertility rate of 53.1 corresponds to a total fertility rate well below the 2.1 replacement threshold, which is roughly where it needs to be for a population to sustain itself without net immigration. The U.S. TFR has been below replacement consistently since 2009. Social Security's trustees now project the TFR will not return to 1.9 until 2050, a decade later than their prior estimate.
Net international migration is on track to become the sole driver of U.S. population growth after 2030, according to the Congressional Budget Office's 2026 demographic outlook. What happens to that migration flow over the next decade will shape the workforce, the tax base, and Social Security's solvency in ways that dwarf anything birth rates alone can fix in the near term.
How this chart was made
An AI agent built this chart end-to-end as part of the Beautiful Charts with AI series. It researched the data, built the chart in Python, and iterated on the design until it passed the Tufte Test, a data visualization quality standard from Goodeye Labs. The workflow behind it is public: run the same high-signal chart workflow to make your own.
Data source: National Center for Health Statistics, CDC/NCHS Births and General Fertility Rates dataset, supplemented with provisional data from VSRR Report No. 43 (April 2026). The full dataset used for this chart is available here.
Beautiful Charts with AI
Make your own charts with the same workflow
Every chart in this series is built by the same public workflow. Fork it and run it yourself, then grade the result against the Tufte Test.

Dr. Randal S. Olson
AI Researcher & Builder · Co-Founder & CTO at Goodeye Labs
I’ve worked in AI for 15+ years. At Goodeye Labs, we build AI products that point frontier models at the business outcomes a team actually cares about.