A short demo on how to use IPython Notebook as a research notebook
As promised, here’s the IPython Notebook tutorial I mentioned in my introduction to IPython Notebook.
Downloading and installing IPython Notebook
You can download IPython Notebook with the majority of the other packages you’ll need in the Anaconda Python distribution. From there, it’s just a matter of running the installer, clicking Next and Accept buttons a bunch of times, and voila! IPython Notebook is installed.
Running IPython Notebook
For Mac and Linux users, open up your terminal. Windows users need to open up their Command Prompt. Change directories in the terminal (using the cd command) to the working directory where you want to store your IPython Notebook data.
To run IPython Notebook, enter the following command:
ipython notebook
It may take a minute or two to set itself up, but eventually IPython Notebook will open in your default web browser and should look something like this:
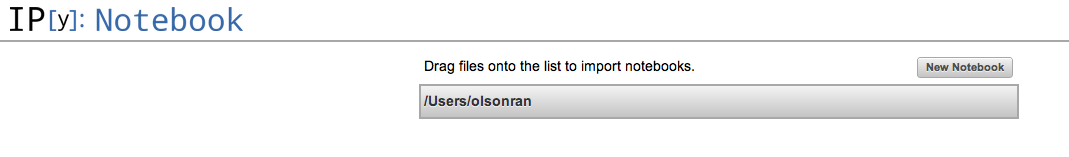
(NOTE: currently, IPython Notebook only supports Firefox and Chrome.)
Creating a new notebook
Conveniently, Titus Brown has already posted a quick demo on YouTube. (Start at 2m16s.)
Now that we’ve covered the basics, let’s get into how to actually use all this as a research notebook.
Using IPython Notebook as a research notebook
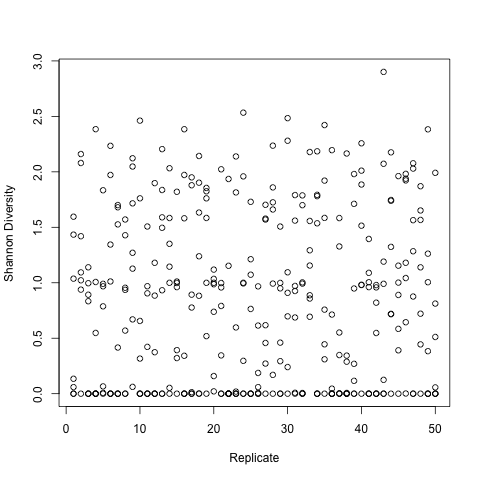
The great part about the seamless integration of text and code in IPython Notebook is that it’s entirely conducive to the “form hypothesis – test hypothesis – evaluate data – form conclusion from data – repeat” process that we all follow (purposely or not) in science. For this example, let’s say we’re studying an Artificial Life swarm system and the effects of various environmental parameters on the swarm.
Here’s the example research notebook: [pdf] [[ipynb w/ accompanying files]
I designed this demo research notebook to be a self-guided tour through the thought process of a researcher as he works on a research project, so hopefully it’s helpful to other researchers out there.
Statistics in IPython Notebook
UPDATE (10/19/2012): Please refer to my other blog post for an up-to-date guide on statistics in Python.
For those of you who (understandably) don’t want to search through an entire research notebook to figure out how to do statistics in IPython Notebook, here’s the cut and dry code.
Reading data
# Library for reading and parsing csv files import csv # My personal library that contains some useful helper functions import rso_stats # Read and parse data for file "control1.csv" control1 = csv.reader(open('control1.csv', 'rb'), delimiter=',') control1, control1_columns = rso_stats.parse_csv_data(control1)
control1 is the dictionary of parsed data
control1_columns is the list of column names used to access the data dictionary, sorted in the same order as the csv data file.
NOTE: This uses a function from my custom Python library, which parses the data into convenient data dictionaries.
The data in the dictionaries can be accessed by:
# Access the first column's list of data control1[control1_columns[0]] # Access the fourth column's list of data control1[control1_columns[3]]
Standard error of the mean
import scipy from scipy import stats mean = scipy.mean(dataset_list) # Compute 2 standard errors of the mean of the values in data_list stderr = 2.0 * stats.sem(dataset_list)
Bootstrapped 95% confidence intervals
The code below shows you how to compute bootstrapped 95% CIs for the mean. However, this function can bootstrap any range of CIs for any statistical function (mean, mode, standard deviation, etc.). Here’s the input parameter description:
Input parameters: data = data to get bootstrapped CIs for statfun = function to compute CIs over (usually, mean) alpha = size of CIs (0.05 --> 95% CIs). default = 0.05 n_samples = # of bootstrap populations to construct. default = 10,000 Returns: bootstrapped confidence intervals, formatted for the matplotlib errorbar() function
import scipy import rso_stats CIs = rso_stats.ci_errorbar(dataset_list, scipy.mean)
NOTE: This uses a couple functions from my custom Python library, since bootstrapping CIs isn’t currently supported by SciPy/NumPy.
Mann-Whitney-Wilcoxon RankSum test
from scipy import stats z_stat, p_val = stats.ranksums(dataset1_list, dataset2_list)
Analysis of variance (ANOVA)
SciPy’s ANOVA function takes two or more dataset lists as its input parameters.
from scipy import stats f_val, p_val = stats.f_oneway(dataset1_list, dataset2_list, dataset3_list, ...)
Hopefully everyone finds this useful. Get in touch if you have any more ideas on IPython Notebook as a research notebook, or if you’d like to figure out how to do some more statistical tests in Python.
A couple more libraries you might be interested in:
Pandas (http://pandas.pydata.org/) provides data structures for things like tables of data, and loads of tools to manipulate them. I had my own module to read/write csv tables until I found this.
Statsmodels (http://statsmodels.sourceforge.net/stable/) has a load of stats tools, although I don’t find the interface very easy.
Thanks for the post – I’m also trying to do stats in Python.
This is exactly the kind of feedback I was hoping for. Thank you, Thomas!
Are there any statistical functions you haven’t been able to find in Python yet? A colleague of mine pointed me to rpy2 (http://rpy.sourceforge.net/rpy2.html), which enables you to run R commands inside Python (including IPython Notebook): something to the tune of rpy2.robjects.r(“any R command”).
You should take a look at scipy (http://www.scipy.org/). They have a lot of statistical tools available. Many are also working with sparse matrices, which makes it really handy.
Hey Philipp, thanks for the tip! I followed up on this post with another post concentrating on scipy and pandas: http://www.randalolson.com/2012/08/06/statistical-analysis-made-easy-in-python/
There’s a fair bit of stuff that we were taught how to do in R that I don’t know how to do in Python (>=two way ANOVA, mixed effects models, and so on). I suspect most of the framework is there to do that sort of thing, but I don’t know enough of the nuts and bolts to work out what I need.
I’ve also come across rpy2. It’s a bit more than just running an R command, it can translate Python objects so you can call R functions on them. The next version of pandas will be able to translate a DataFrame into an R data.frame, which will be very useful.
Thomas,
When you say the next version of Pandas which is the current version you are running? I’m new to Python but have used R for a long time. However, I’m starting to use Python for a few things and maybe one day will make a switch.
Thanks,
DK
I’m fairly sure the feature Thomas discussed is in pandas now: http://stackoverflow.com/questions/11511880/issue-converting-python-pandas-dataframe-to-r-dataframe-for-use-with-rpy2
I also recommend checking out Rmagic (http://www.randalolson.com/2013/01/14/filling-in-pythons-gaps-in-statistics-packages-with-rmagic/) for anything you can’t do 100% in Python yet.
Yep, both pandas and rpy2 now support converting pandas DataFrames into R data.frames. Rmagic in the development version of IPython (which will become 1.0, at long last) uses these, so you should be able to push a DataFrame into R to analyse it.
I found your demo useful, I have never used python notebook and been living with python as is. The notebook option looks very convenient and that you can use it as a log with log notes included together with code. I will test this myself later on.
I’d recommend Anacondas, a package of data analysis packages for python
https://store.continuum.io/cshop/anaconda/
It contains matplotlib, among other things, which is really great for plotting information, something I find goes particularly well with the iPython notebook!
Of course! I strongly Anaconda as well now. It didn’t exist a few years ago when I first published this post. 🙂
🙂 ah, the speed of the internet…
Thank you for both this and your updated stats tutorial! I’ve been using python in data analysis for years but only recently got in to Anaconda and the iPython notebook and your stuff has been super helpful.
that’s great. but I can not imagine coding so complicated logic to build an interactive graph in notebook, and what’s more, which will definitely make the content larger and larger, more and more difficult to maintain. And in my opinion, notebook is a perfect place to test/run your logic code, and we just need a place to display/report/share the result with people out there, and most people doesn’t have to know the logic of how the result is given out. So I build a dashboard for ipython, it’s used by some of my colleagues, and I’ll continue adding some features on that. the project is here : https://github.com/litaotao/IPython-Dashboard . and here is the demo: http://litaotao.github.io/IPython-Dashboard/
thanks,
ipithon notebook wouldn’t start on windows without additional hacks: http://stackoverflow.com/questions/39822793/ipithon-notebook-doesnt-work