U.S. Racial Diversity by County
Published on April 29, 2014 by Dr. Randal S. Olson
county ethnicity map racial diversity united states
2 min READ
The U.S. is typically viewed as a melting pot of races and cultures, but recent maps showing the ethnic distribution of the U.S. seem to hint that the U.S. isn't as well-mixed as we all thought. In this visualization, I mapped out the racial/ethnic diversity of the U.S. to give us a better sense of the hotspots of diversity.
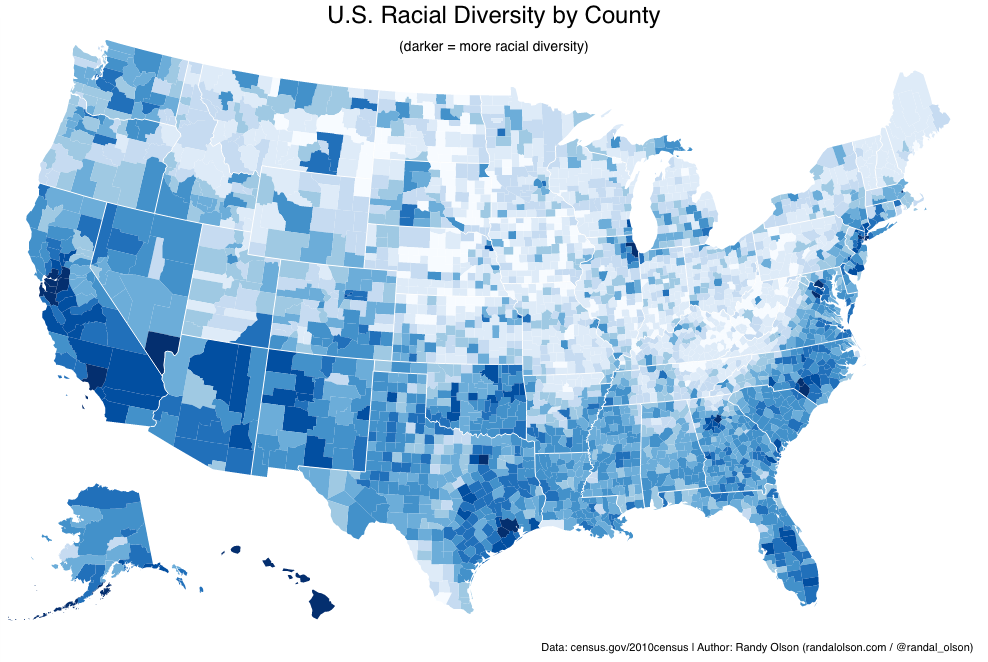
To calculate racial/ethnic diversity, I computed the entropy on the "% ethnicity" data for each county using the 6 ethnic categories the U.S. Census tracks: White (non-Latino), African American, Native American, Asian American, Latino, and Other. A county will come out with high entropy when all 6 ethnic categories are as even as possible (i.e., each ~16.7%), whereas it will come out with low entropy if the county is only inhabited by people of one ethnic category. I've included the raw census data if you want to tinker with it yourself.
One of the most notable features is that the Midwest and Northeast are fairly homogeneously white. Vermont, New Hampshire, and Maine stand as the pinnacle of racial homogeneity, each with only one or two counties with even a blip of diversity. The only exceptions to this trend are the major cities throughout the U.S., which seem to attract people of all ethnicities regardless of the state the city is in.
As a Michigander, I'm the most surprised to see how diverse the Upper Peninsula is. I thought only crazy white people lived up that far in Michigan.
Here's the least diverse counties:
- Tucker County, West Virginia (100% White, non-Latino)
- Robertson County, Kentucky (100% White, non-Latino)
- Hooker County, Nebraska (100% White, non-Latino)
- Hand County, South Dakota (99% White, non-Latino and 1% Latino)
- Owsley County, Kentucky (98% White, non-Latino and 2% Latino)
And the most diverse counties:
- Aleutians West Census Area, Alaska (31.4% White (non Latino), 5.7% African American, 15.1% Native American, 28.3% Asian American, 13.1% Latino, and 6.4% Other)
- Aleutians East Borough, Alaska (13.5% White (non Latino), 6.7% African American, 27.7% Native American, 35.4% Asian American, 12.3% Latino, and 4.4% Other)
- Queens County, New York (27.6% White (non Latino), 17.7% African American, 0.3% Native American, 22.8% Asian American, 27.5% Latino, and 4% Other)
- Alameda County, California (34.1% White (non Latino), 12.2% African American, 0.3% Native American, 25.9% Asian American, 22.5% Latino, and 5.1% Other)
- Solano County, California (40.8% White (non Latino), 14.2% African American, 0.5% Native American, 14.3% Asian American, 24% Latino, and 6.2% Other)