156 years of marriage and divorce in the United States
Part of Teaching an AI Agent to Make Beautiful Charts
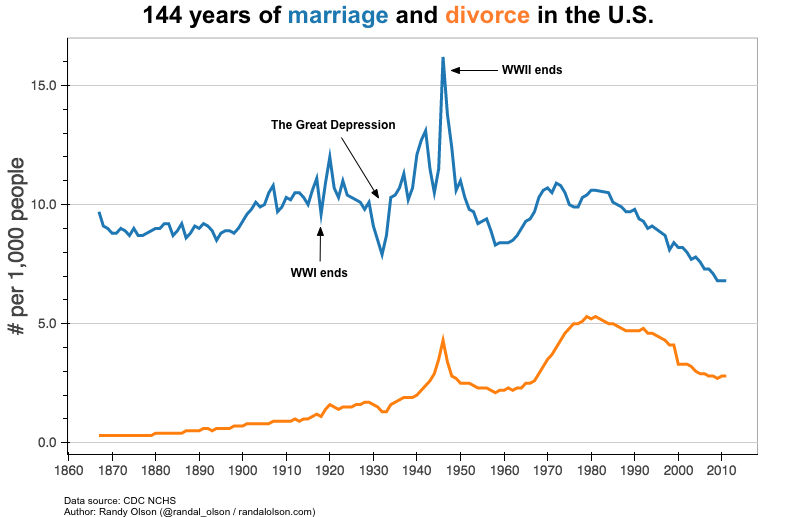
Back in 2015, I charted 144 years of U.S. marriage and divorce data after scraping dozens of CDC reports by hand. That post ended at 2014. The CDC has since published updated figures through 2023, so I pointed an AI agent at the original dataset and told it to bring the chart up to date.
Wars and weddings
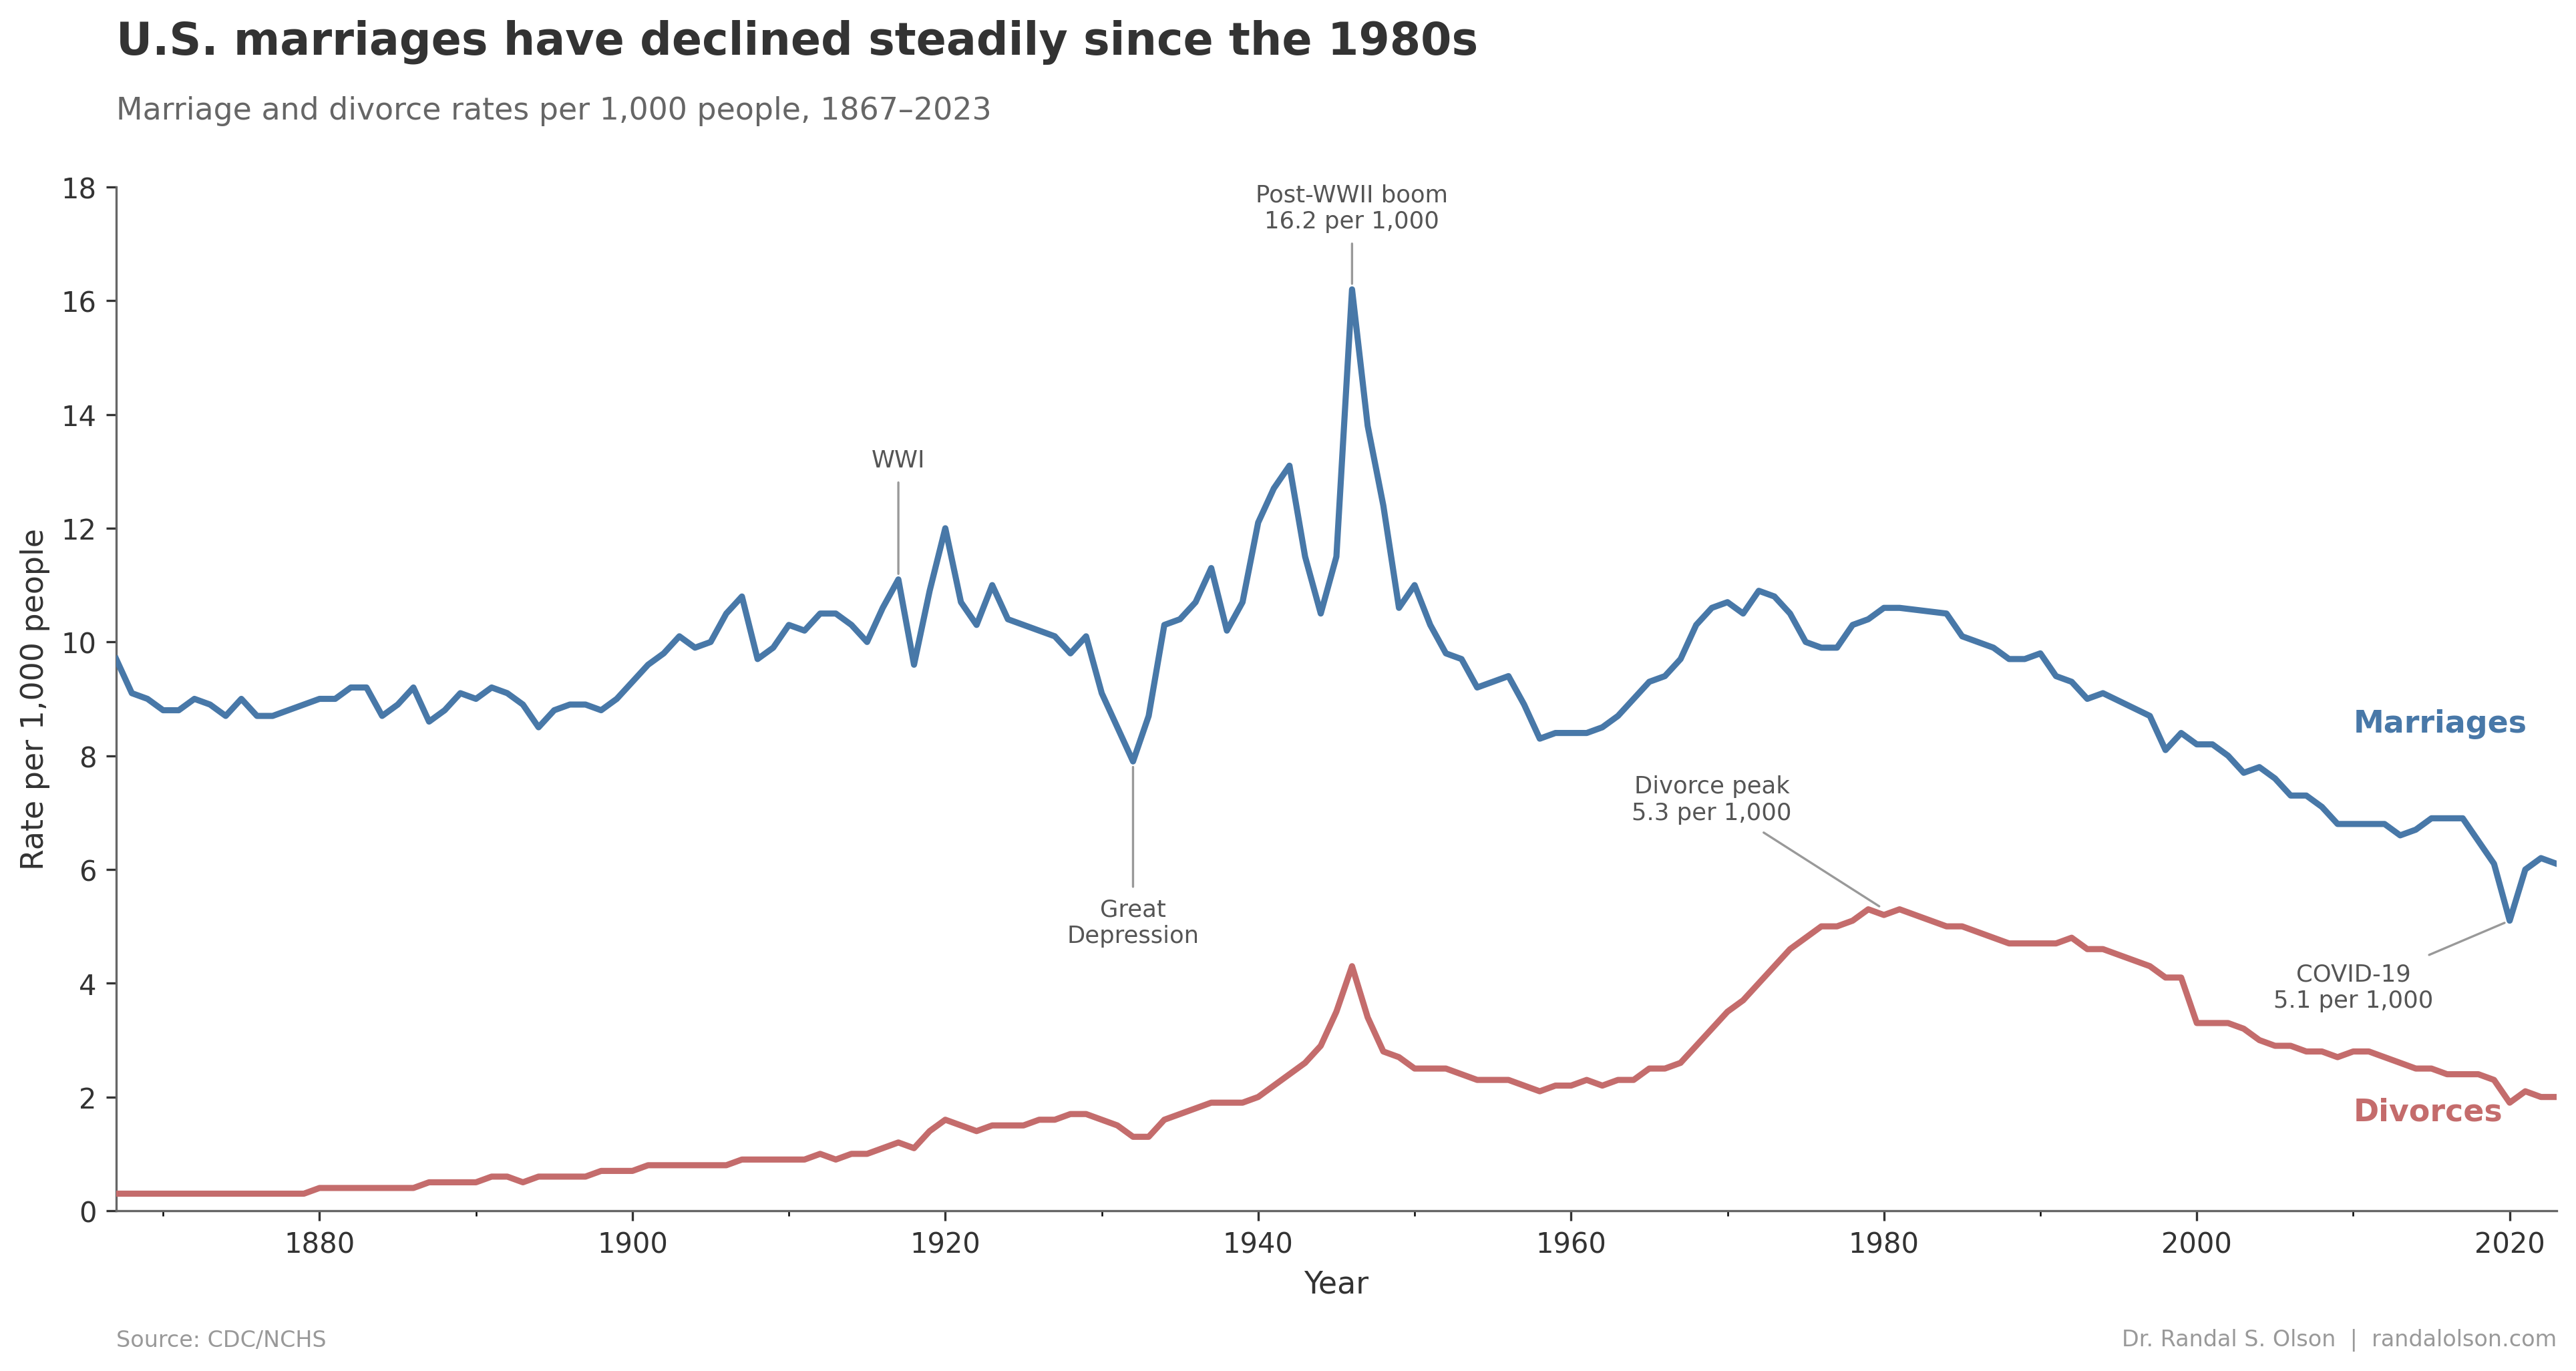
The post-WWII marriage boom in 1946 hit 16.2 per 1,000 people, the highest rate in the entire dataset. Soldiers came home, and the GI Bill's zero-down-payment home loans made it possible to start a family right away. VA-backed loans funded nearly 2.4 million home purchases between 1944 and 1952.
The same pattern shows up at a smaller scale around WWI: a spike when the U.S. entered the war in 1917 (11.1), a dip while the men were overseas, and another spike when they returned in 1920 (12.0).
Less discussed: the only notable spike in divorce rates in 156 years of data also followed WWII, jumping to 4.3 per 1,000 in 1946. Couples who barely knew each other before one shipped overseas came home to find they were strangers. Meanwhile, women who had entered the workforce in record numbers during the war now had the economic independence to leave bad marriages.
The Great Depression and economic hardship
The sharpest drop in marriage rates before the modern era came during the Great Depression. By 1932, the rate had fallen to 7.9 per 1,000, a 25% decline from just a few years earlier. When Americans fell on hard times, marriage was one of the first things to take the back seat. The rate bounced back quickly once the economy recovered, reaching 10.3 by 1934.
The long decline since the 1980s
The marriage rate was 10.6 per 1,000 in 1980. By 2023 it had fallen to 6.1. That's a 42% decline over four decades, and unlike the war-era dips, this one shows no sign of bouncing back. Cohabitation explains some of the gap: Pew found in 2019 that among adults 18-44, more had lived with an unmarried partner (59%) than had ever been married (50%).
Divorce followed a parallel arc. Rates rose sharply through the 1960s and 70s, peaked at 5.3 per 1,000 around 1979-1981, then fell steadily to 2.0 by 2023. The spike lines up with the spread of no-fault divorce laws: California passed the first one in 1969, and virtually every state followed by the early 1980s. The decline since then is probably simpler: fewer people getting married means fewer marriages to dissolve.
COVID-19 set a new record low
The 2020 COVID lockdowns drove marriage rates to 5.1 per 1,000, the lowest in 156 years of data. Lower than the Great Depression, lower than the Civil War era. Rates bounced back to 6.0-6.2 in 2021-2022, but 2023 sits at 6.1, right back on the declining trendline.
How this chart was made
An AI agent built this chart end-to-end as part of the Beautiful Charts with AI series. It pulled the latest CDC data, built the chart in Python, and iterated on the design until it passed the Tufte Test, a data visualization quality standard built by Goodeye Labs on Truesight.
Data source: CDC National Center for Health Statistics (2000-2023), combined with historical data I scraped from CDC reports back in 2015 (1867-1999). The full merged dataset is available here.
Tags
Related Posts

Dr. Randal S. Olson
AI Researcher & Builder · Co-Founder & CTO at Goodeye Labs
I turn ambitious AI ideas into business wins, bridging the gap between technical promise and real-world impact.