A thousand springs in Kyoto, in one chart
Part of Teaching an AI Agent to Make Beautiful Charts
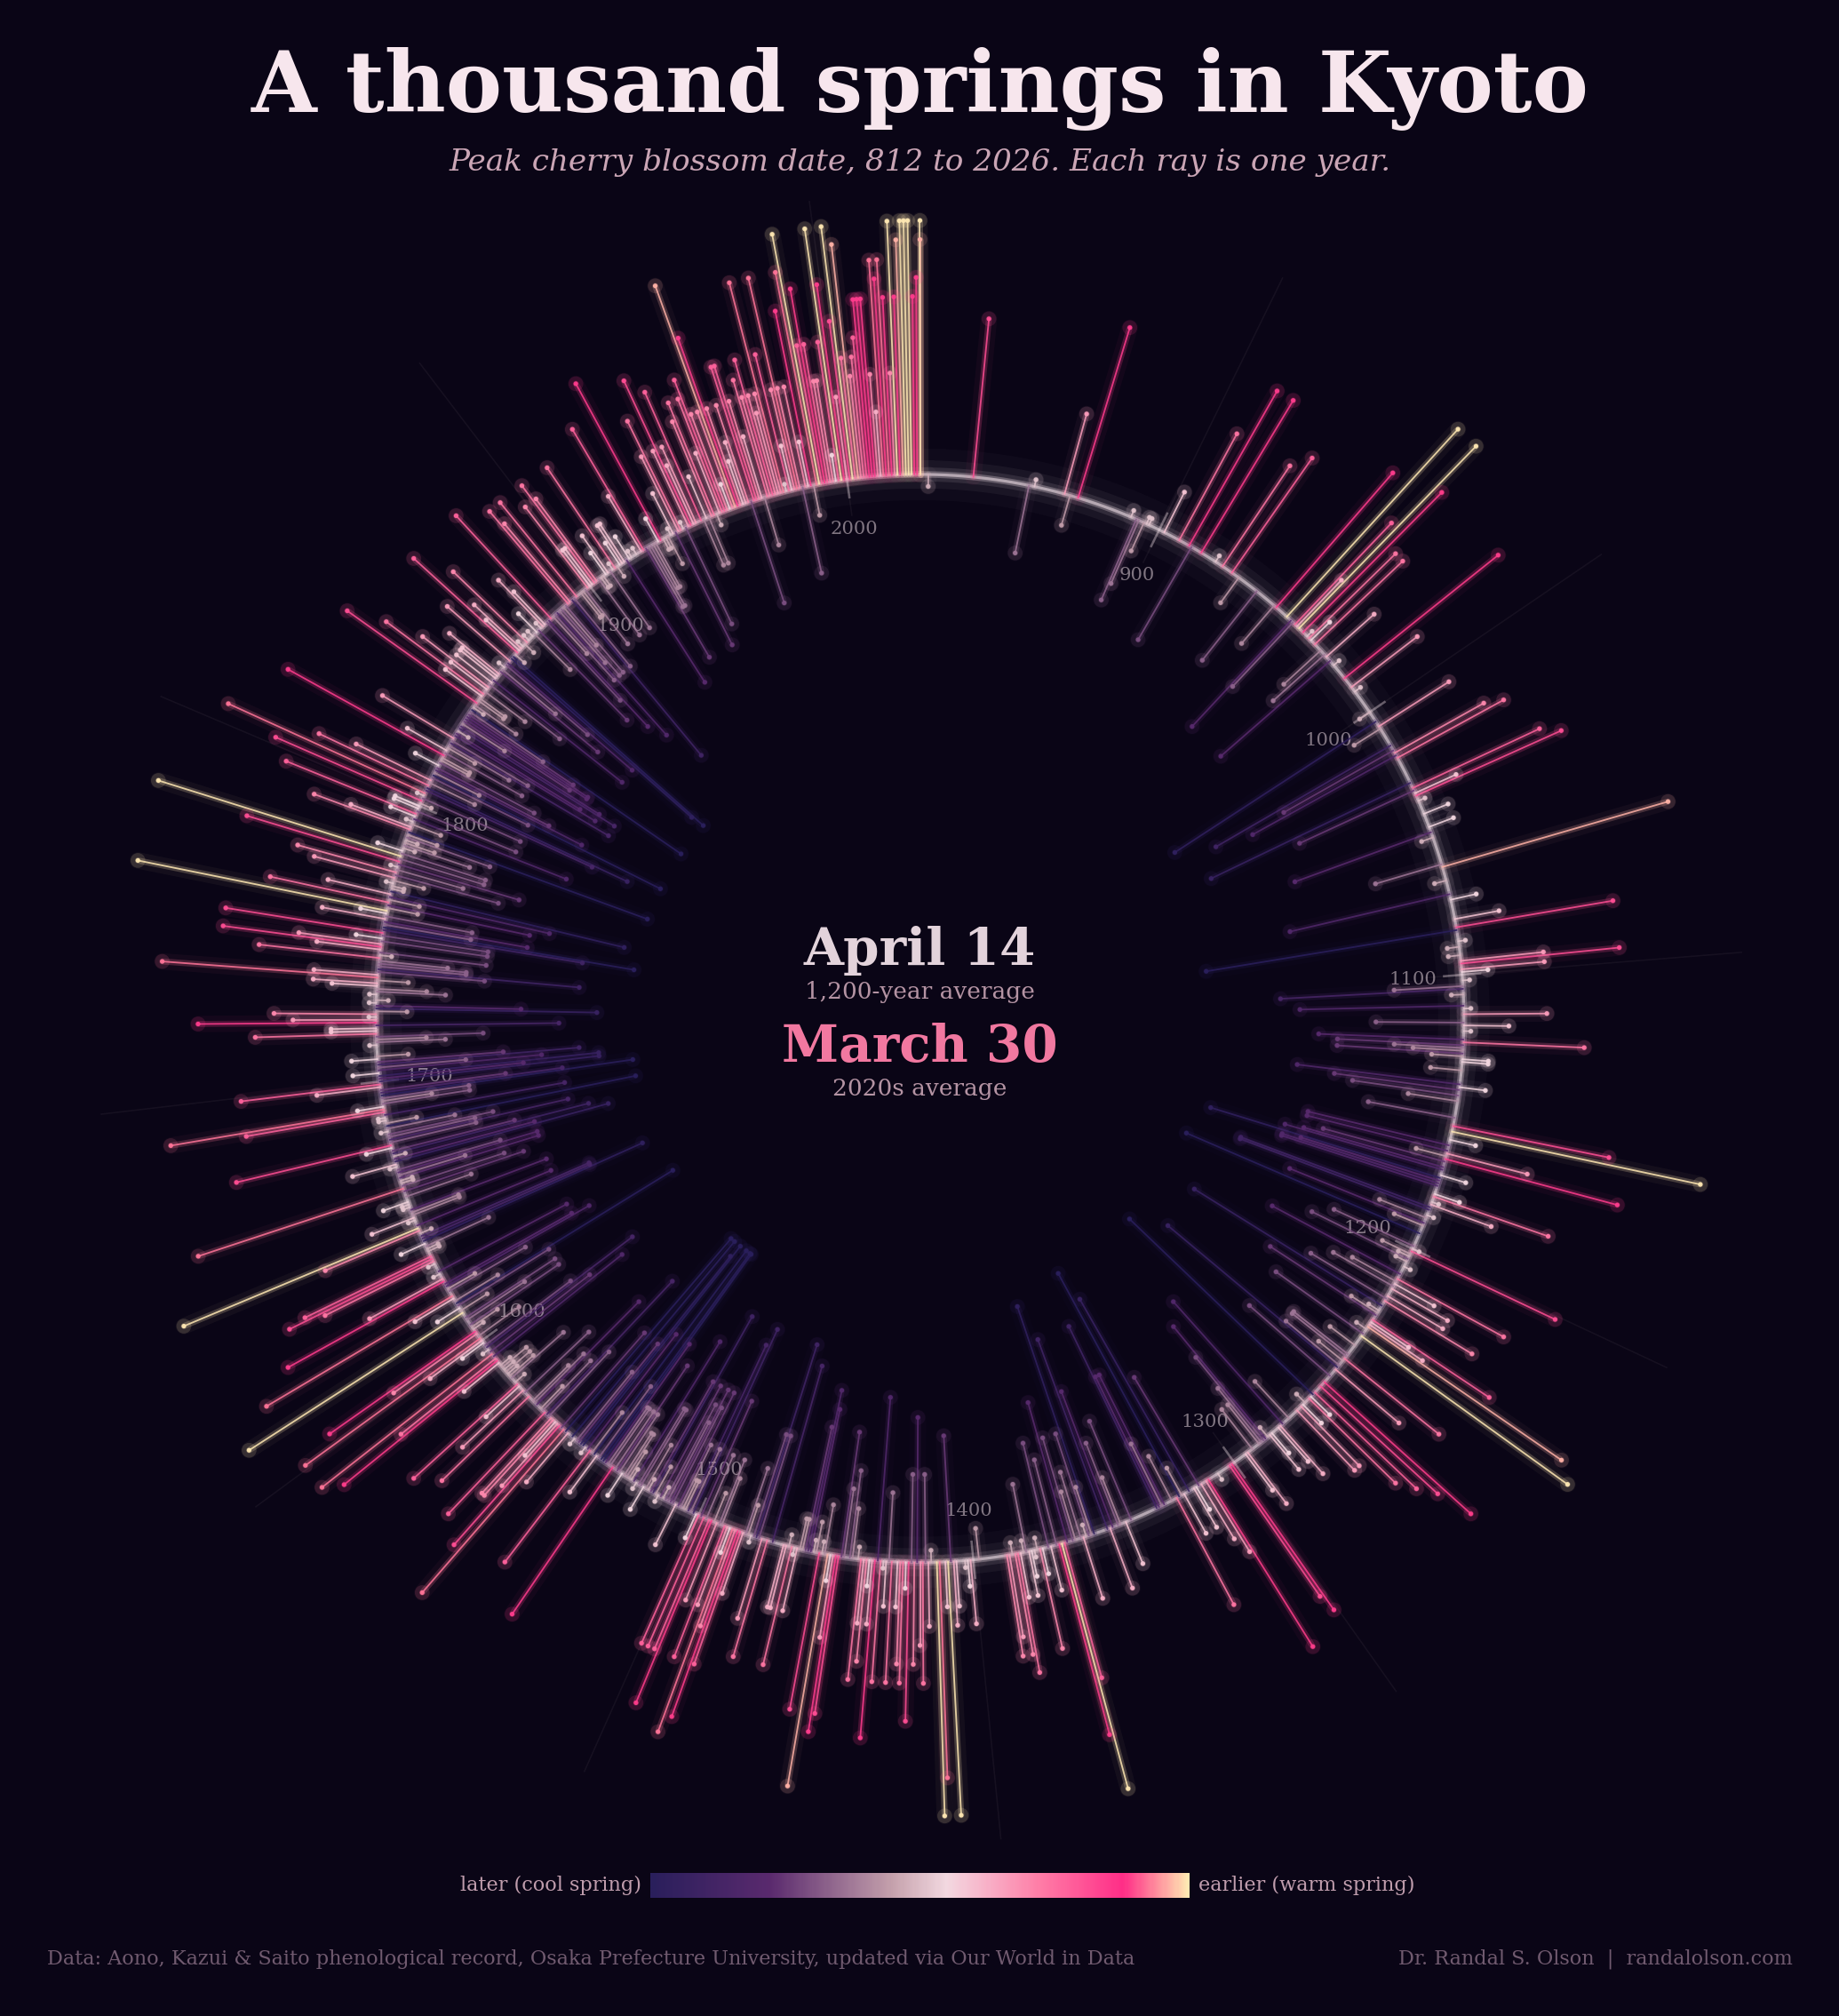
Kyoto has been watching its cherry trees bloom for more than a thousand years. Aristocrats, monks, and emperors wrote the dates down in diaries and court records, and a phenologist named Yasuyuki Aono spent years pulling those mentions together into a single dataset. The result is one of the longest continuous biological records in the world: 838 years of recorded full-flower dates, stretching from 812 CE all the way through the 2026 season.
For most of Kyoto's history, the cherry trees bloomed around April 14
Each ray on the chart is one year of observation, placed around the circle chronologically. The luminous band running through the middle is the long-term average: day 104 of the year, or roughly April 14. From the 800s through the 1800s, bloom dates drifted around that ring. Warmer and cooler decades produced clusters that reached in or out, but the center of gravity held steady for over a thousand years. The 1,200-year average and the pre-1900 average differ by less than a day.
The last 60 years have no parallel in the record
Look at the top of the ring, the arc covering the 20th and 21st centuries. It is magenta in a way no other stretch of the chart is. The average full-flower date since 1950 is April 7, 7 days earlier than the long-term average. The 2020s on their own average March 30, almost 15 days earlier. The shift is not a single warm year or a brief episode; it is a sustained pull on the entire distribution.
Individual extreme years have always happened. 1409 produced a March 27 bloom that was the earliest in the medieval record. 1323 delivered a May 4 bloom, the latest ever recorded. What is new is the recent concentration of records: 2023 set an all-time earliest at March 25 (day 84), and 2021 came in one day behind at March 26. Singular extremes used to punctuate a stable baseline. Now the baseline has moved, and the records keep falling.
Why this record exists at all
The data was preserved because of culture, not science. Cherry blossom viewing, hanami, has been a civic and imperial occasion in Kyoto since at least the 9th century. The date of full flower was logged the way a modern city might track its first snowfall or the opening day of a farmers' market. Aono and Saito combined those scattered court references into a usable phenological series; their 2010 paper reconstructs March temperatures in Kyoto from the bloom dates and finds that modern warming separates cleanly from the pre-industrial baseline.
How this chart was made
An AI agent built the chart end to end: picking the radial form to match the subject, assembling the data, iterating against the Tufte test, a data visualization quality standard from Goodeye Labs, and drafting the post. For this piece the brief was beauty first, so the form leans more ornamental than strictly Tuftean. The source is the Aono, Kazui, and Saito 1,200-year Kyoto cherry tree flowering record from Osaka Prefecture University, extended through 2026 by Our World in Data. The cleaned year-and-day-of-year CSV is available: kyoto-sakura-1200-years.csv. The workflow behind it is public: run the same high-signal chart workflow to make your own.
Beautiful Charts with AI
Make your own charts with the same workflow
Every chart in this series is built by the same public workflow. Fork it and run it yourself, then grade the result against the Tufte Test.

Dr. Randal S. Olson
AI Researcher & Builder · Co-Founder & CTO at Goodeye Labs
I’ve worked in AI for 15+ years. At Goodeye Labs, we build AI products that point frontier models at the business outcomes a team actually cares about.