U.S. oil: from peak importer to net exporter in one decade
Part of Teaching an AI Agent to Make Beautiful Charts
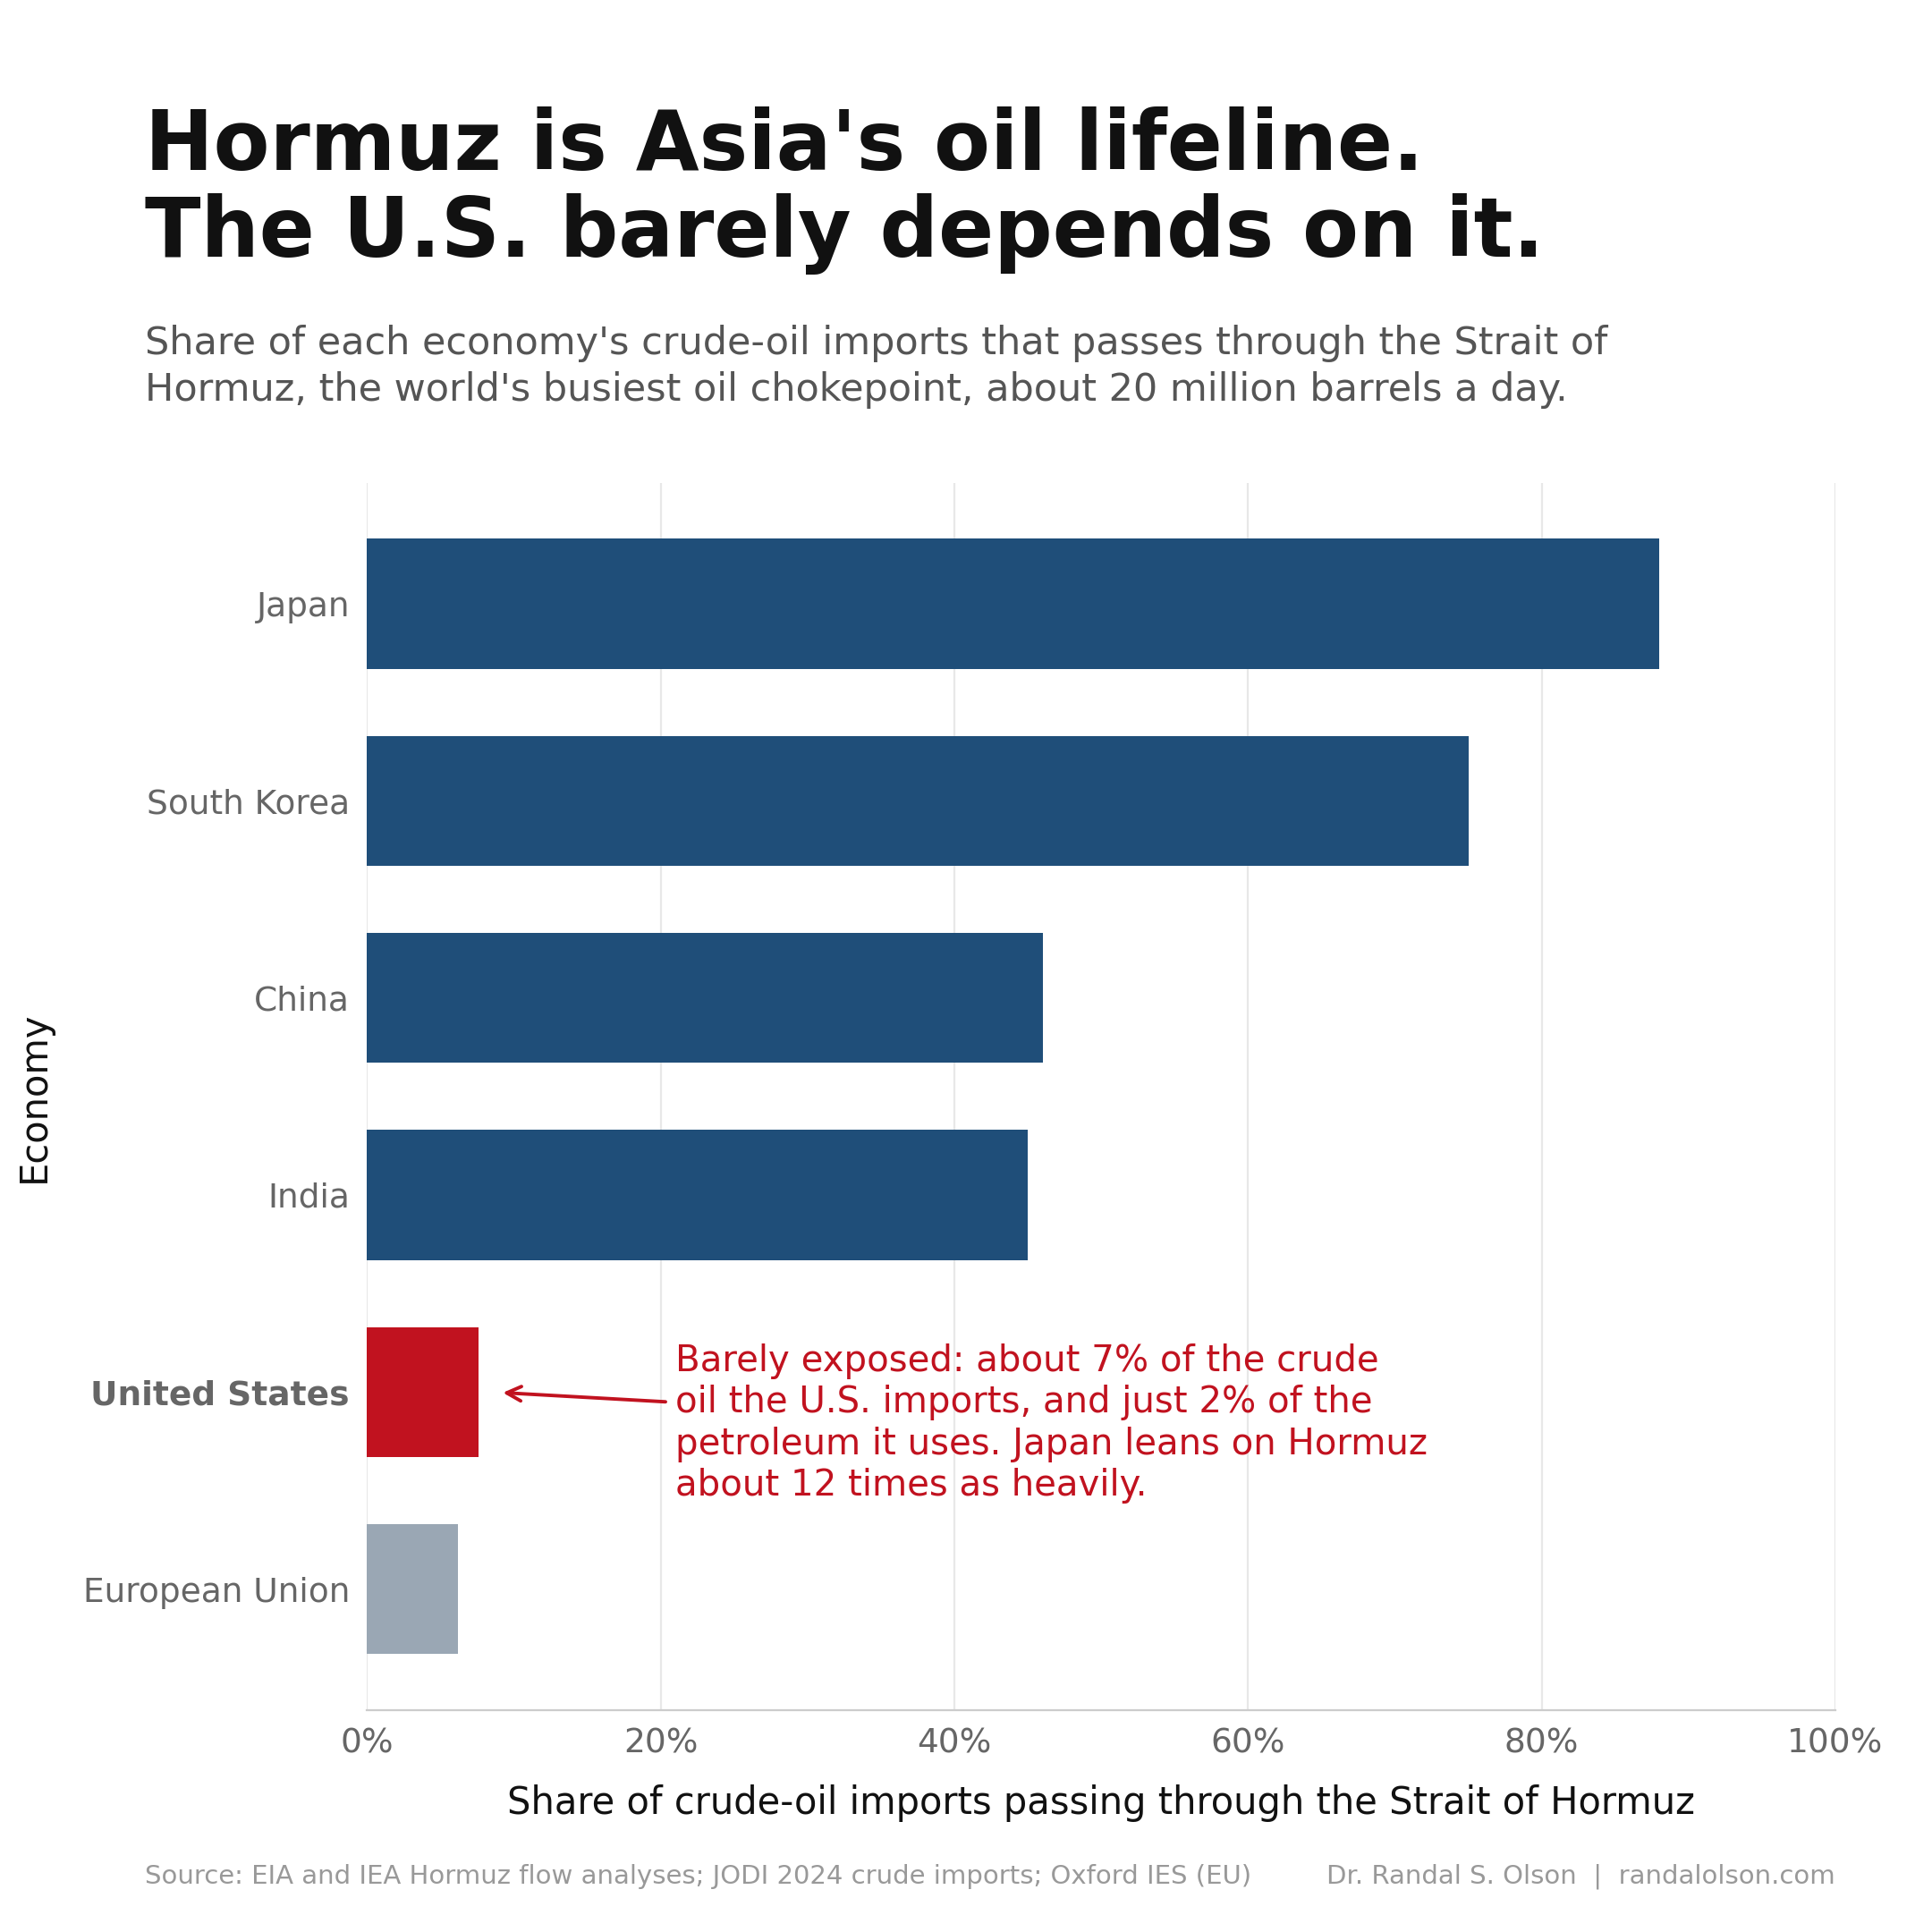
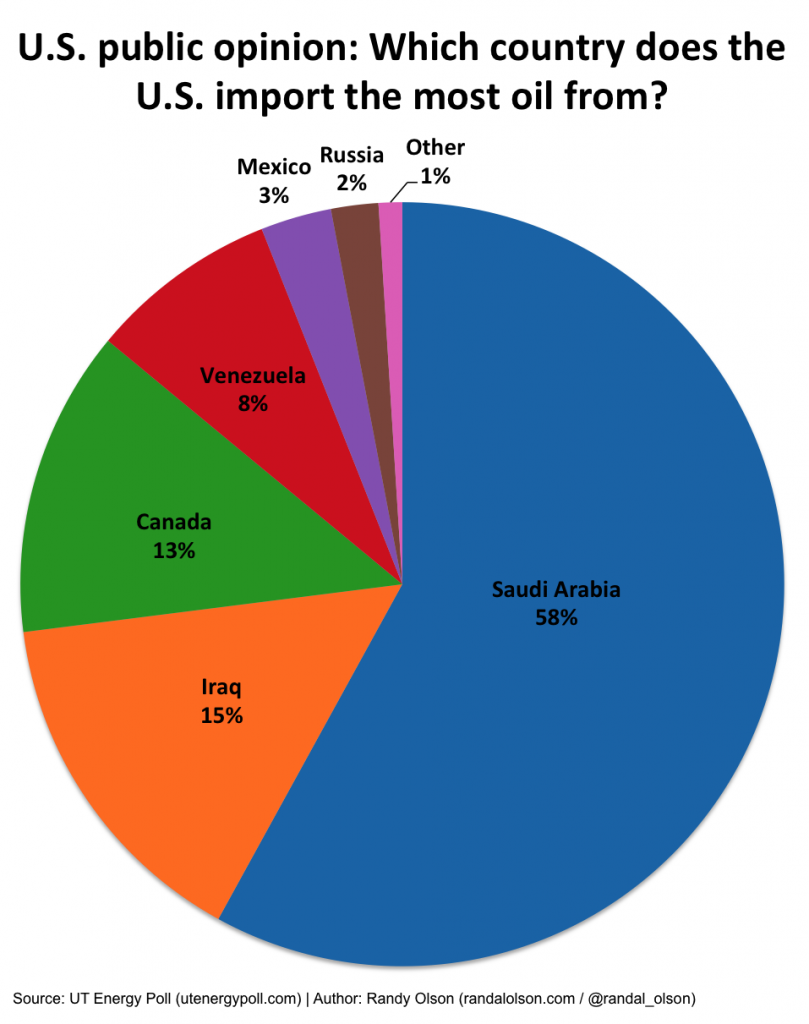
Back in 2014 I wrote a post titled Where the U.S. gets its oil from, pointing out that public opinion wildly overestimated how much oil came from the Middle East. The real top supplier was Canada, and 60% of what the country burned was produced at home. That was the story in 2014. It is not the story now. The U.S. has been a net exporter of petroleum since 2020, and in 2025 it exported 2.8 million barrels per day more than it imported.
Peak dependence was 2005, not 1979
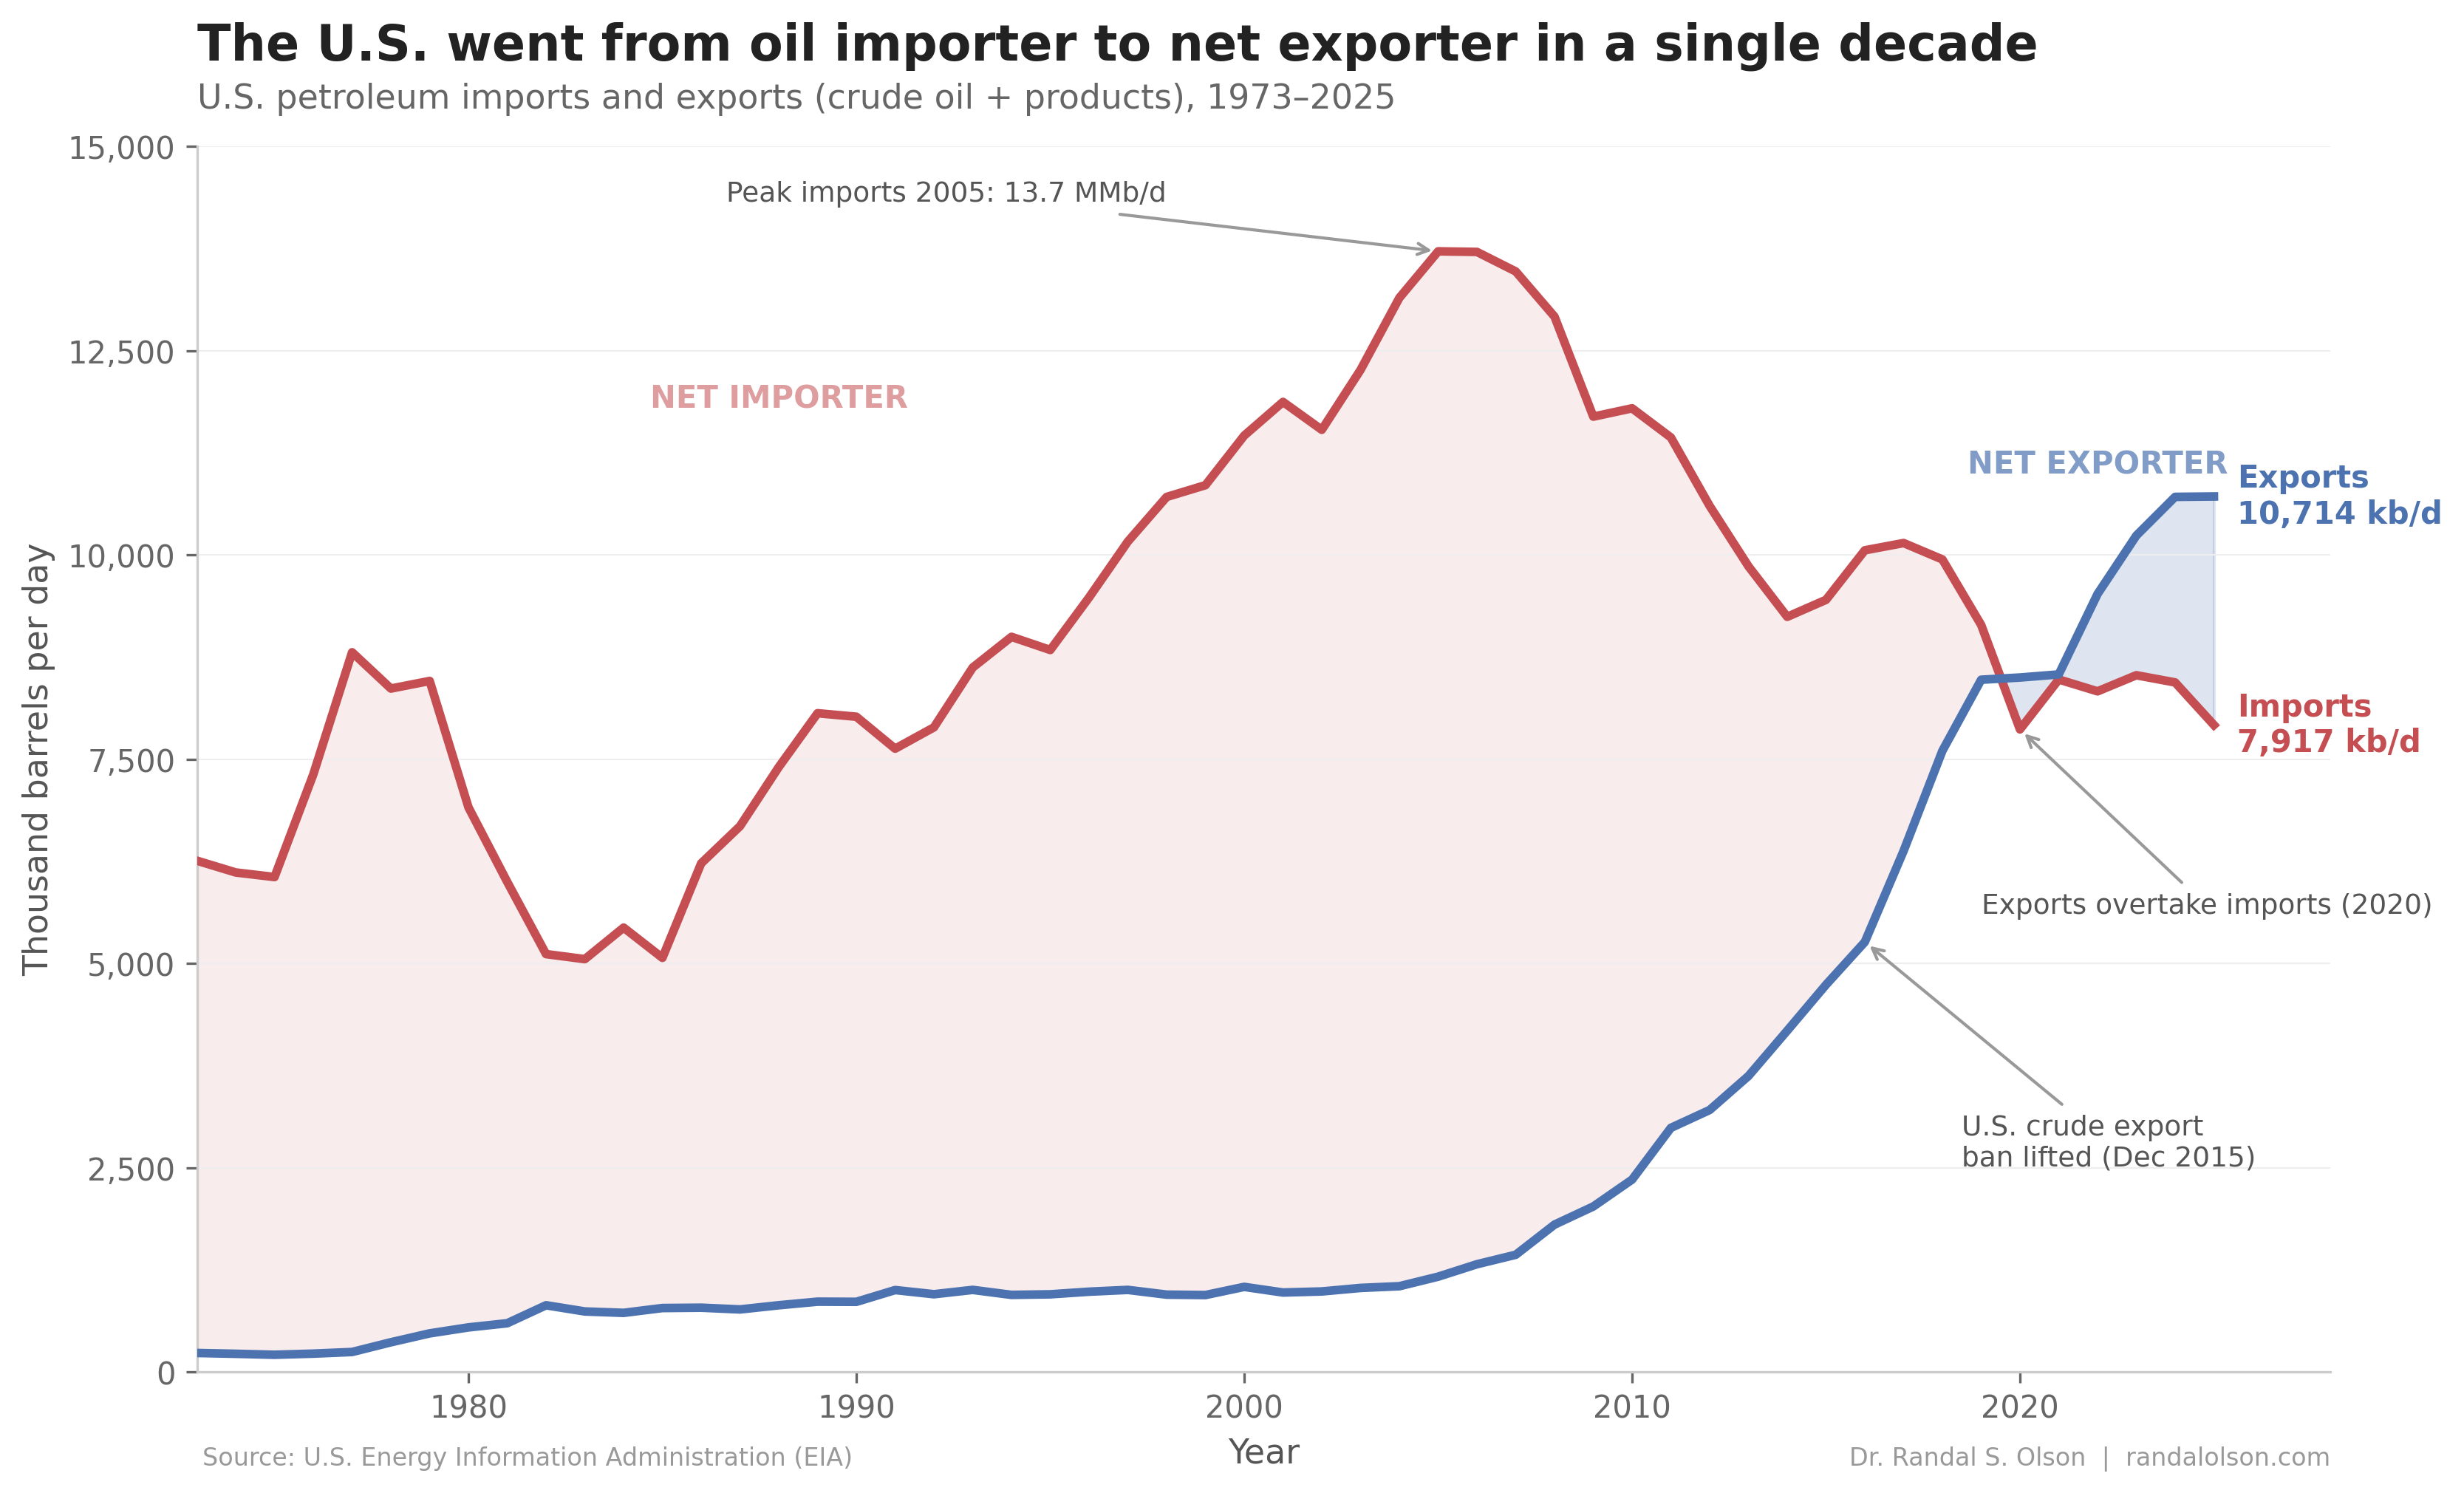
The mental picture most people carry of U.S. oil dependence belongs to the 1970s: gas lines, the Arab oil embargo, Carter's cardigan. The actual peak came much later. U.S. petroleum imports hit 13.7 MMb/d in 2005, the highest in recorded history. Net imports peaked the same year at 12.5 MMb/d. The country was buying more foreign oil than at any point before or since, and domestic production had been grinding down for 35 years straight.
That was the bottom of a long slope. Domestic crude production fell from 9.6 MMb/d in 1970 to about 5.0 MMb/d in 2008. Everyone assumed that curve kept going down forever. It did not.
The shale revolution is what actually changed
The reversal in the chart is driven by one thing: domestic production. Combining horizontal drilling with hydraulic fracturing made it economic to extract oil from tight shale formations that older vertical wells could not touch. Horizontal wells that once extended 2,000 feet now routinely exceed 15,000 feet, with dozens of separate fracking stages along each lateral.
The technique first scaled in the Barnett Shale in Texas around 2005 for natural gas, then was adapted to oil in the Bakken (North Dakota), Eagle Ford (South Texas), and the Permian Basin (West Texas and New Mexico). Those three plays now produce roughly 90% of U.S. tight oil. Between 2010 and 2019, U.S. shale oil production added more than 7 MMb/d, and by 2025 U.S. crude production hit an all-time record of 13.6 MMb/d, 2.7x the 2008 low.
The 2015 law that opened the gates
Production alone would not have flipped the trade balance this hard. The exports line on the chart stays near zero for four decades because it had to. The Energy Policy and Conservation Act of 1975 banned most crude oil exports in response to the Arab oil embargo, and the ban held for 40 years. Refined products (gasoline, diesel, jet fuel) could leave, but raw crude could not.
That changed on December 18, 2015, when President Obama signed the Consolidated Appropriations Act, which repealed the ban as Section 101 of Division O. A week later, the Commerce Department confirmed that "a license is no longer required to export crude oil" from the United States. U.S. crude oil exports went from 0.5 MMb/d in 2015 to 4.1 MMb/d in 2024. That surge is the second half of the chart.
2020: the crossover
The two lines cross for the first time in 2020. COVID demand destruction helped: the pandemic flattened import volumes and pulled global crude prices negative for a few hours in April. But the trajectory was already obvious before the lockdowns, and it held after them. Every year since 2020 has been a net-export year, and 2025 set a record at 2.8 MMb/d of net exports.
The U.S. still imports a lot of oil: 7.9 MMb/d in 2025, mostly heavy crude that Gulf Coast refineries were built to process. The composition is much simpler than it was in 2014, though. Canada supplied 62% of U.S. crude oil imports in 2024, a record share driven by the May 2024 completion of the Trans Mountain pipeline expansion from Alberta. Mexico is a distant second, shipping 464,000 b/d of crude in 2024, down 37% from 2023 as Mexican field productivity fell. Venezuela, once a leading supplier, was at roughly 150,000 b/d in late 2025 under intermittent sanctions.
What my 2014 post got right, and what it missed
I was right that the Middle East was never the main supplier. That misconception was wrong then and is even more wrong now. What I did not anticipate, because the data did not yet show it, was how quickly the whole question would stop mattering. "Where does the U.S. get its oil from" was the right question in 2014. In 2025 the more useful question is "where is all this U.S. oil going?" The answer, per the EIA's 2024 export breakdown, is mostly Europe and Asia. The Netherlands (home to Rotterdam's trading hub) received the most U.S. crude in 2024 at 825,000 b/d, followed by South Korea, Canada, the U.K., Singapore, and India. Europe as a whole took 1.93 MMb/d, a record share after the 2022 sanctions cut Russian barrels off from Western markets.
How this chart was made
An AI agent built this chart end-to-end as part of the Beautiful Charts with AI series. It pulled the latest EIA data, prototyped three candidate chart types, picked the one that told the reversal story most clearly, and iterated on the design until it passed the Tufte Test, a data visualization quality standard from Goodeye Labs. The workflow behind it is public: run the same high-signal chart workflow to make your own.
Data source: U.S. Energy Information Administration, series MTTIMUS2 (imports) and MTTEXUS2 (exports), crude oil plus petroleum products, annual. The combined 1973-2025 dataset is available here.
Beautiful Charts with AI
Make your own charts with the same workflow
Every chart in this series is built by the same public workflow. Fork it and run it yourself, then grade the result against the Tufte Test.

Dr. Randal S. Olson
AI Researcher & Builder · Co-Founder & CTO at Goodeye Labs
I’ve worked in AI for 15+ years. At Goodeye Labs, we build AI products that point frontier models at the business outcomes a team actually cares about.