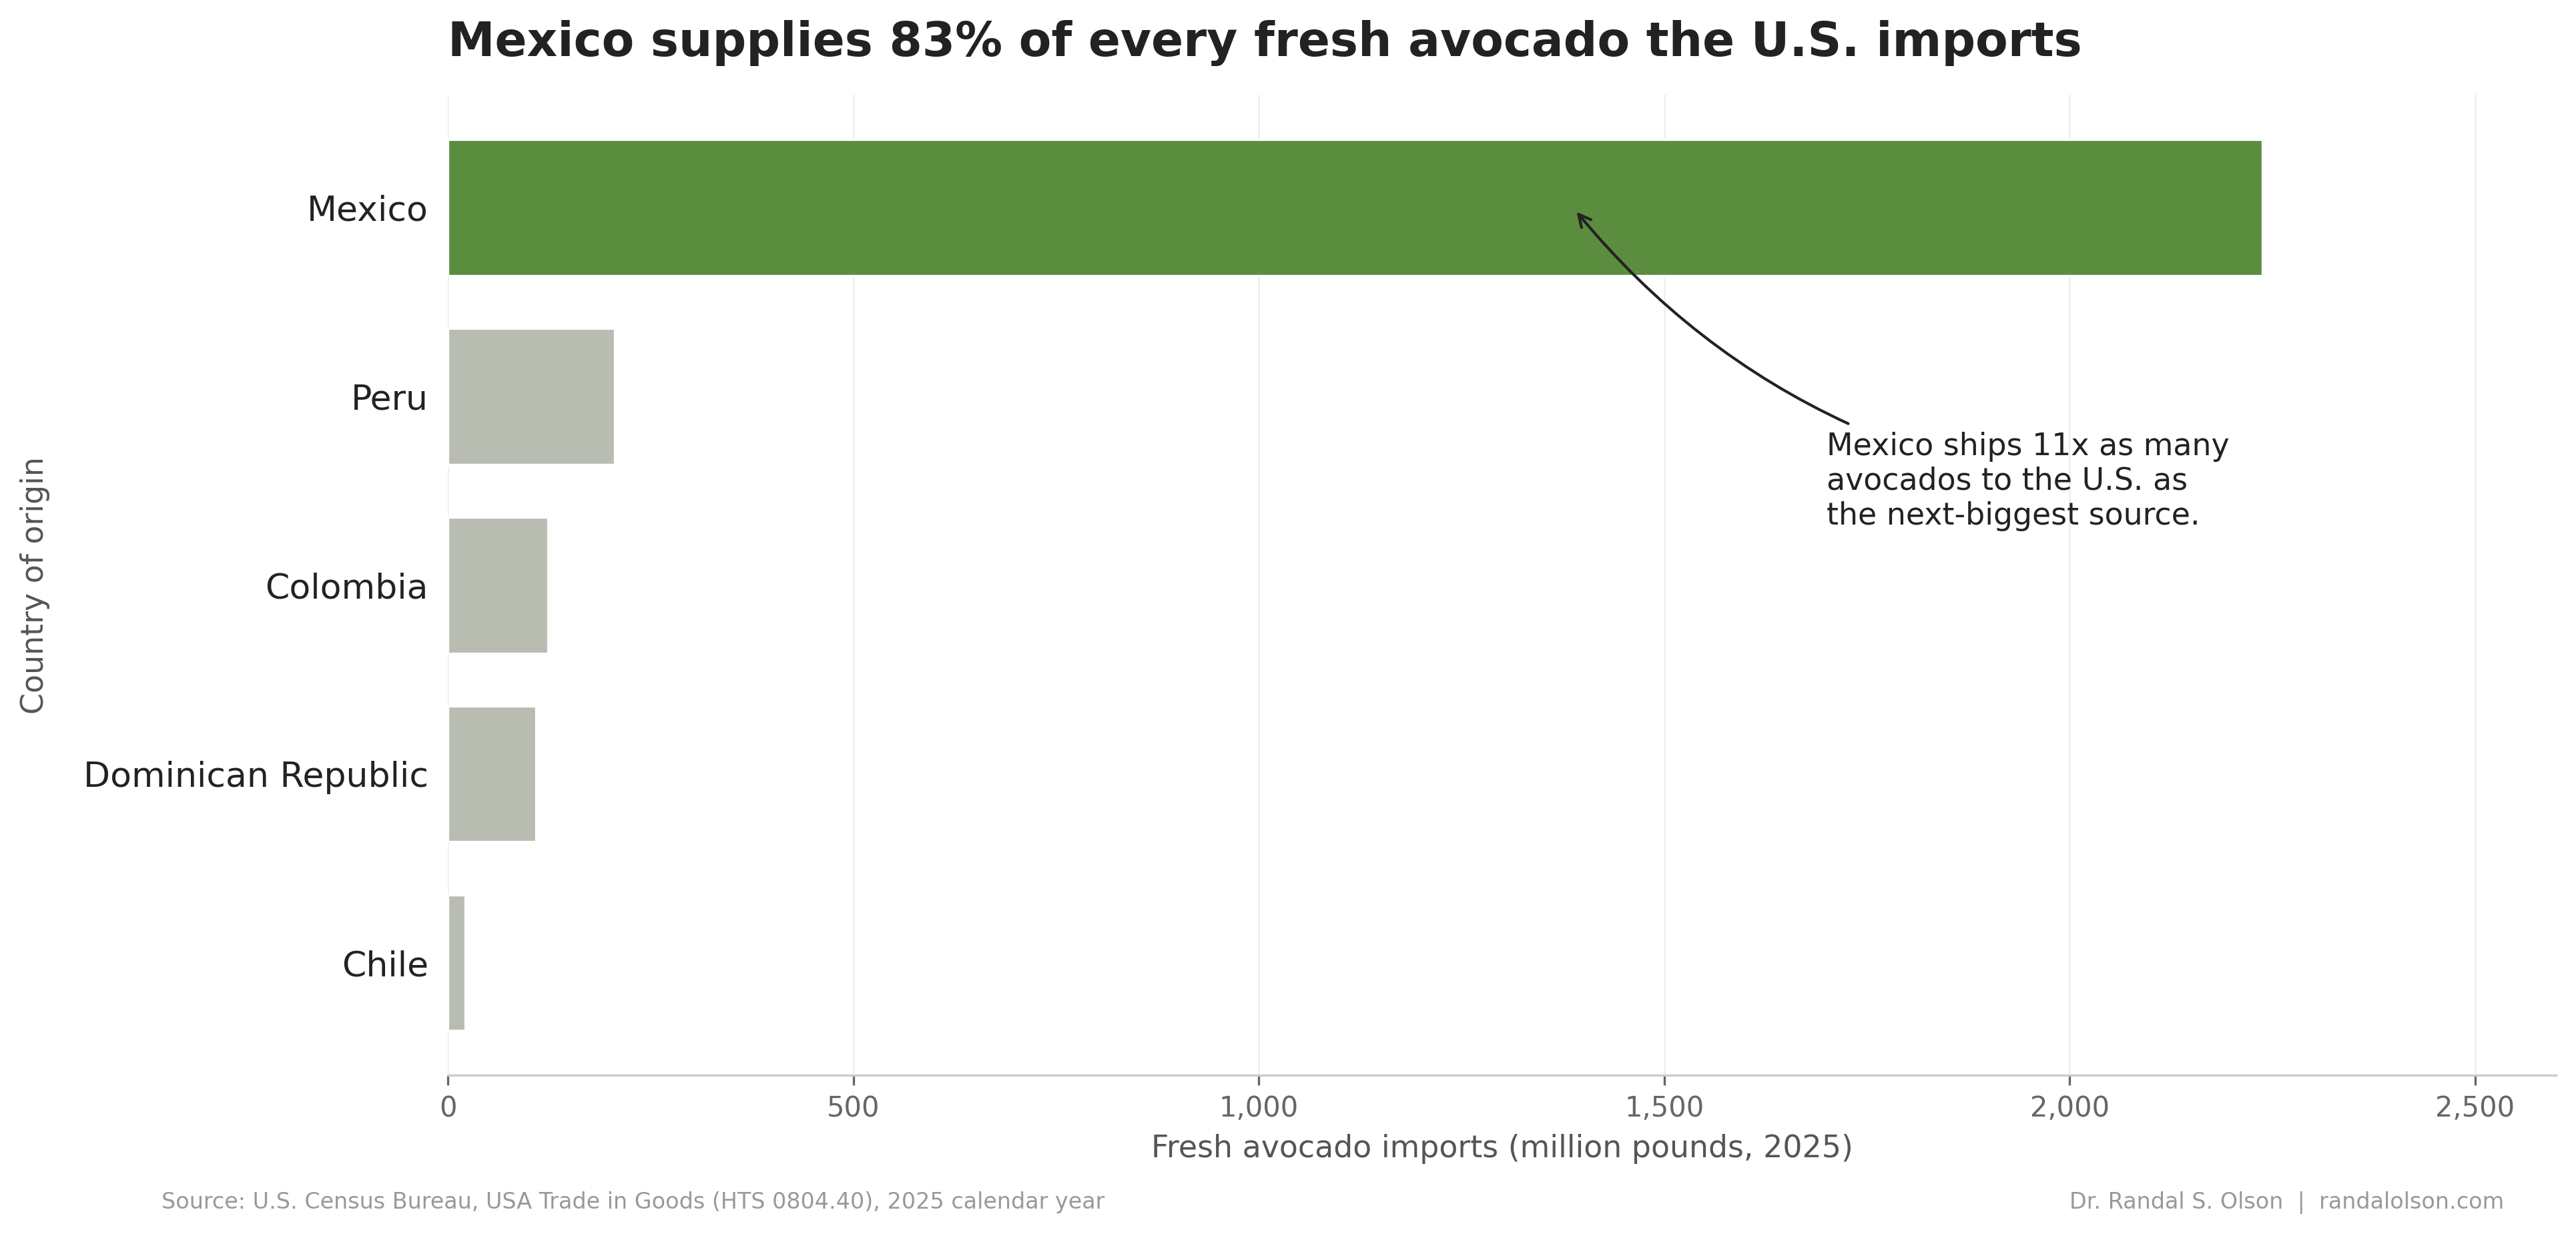
Mexico ships 83% of every fresh avocado the U.S. imports
Part of Teaching an AI Agent to Make Beautiful Charts
Cinco de Mayo is the second-biggest avocado day in the U.S., behind only Super Bowl Sunday. About 81 million pounds will get smashed into guac, sliced onto tacos, or piled on toast today. Almost none of those avocados were grown here. The vast majority came from a single country, and even more specifically, from a single state inside that country.
One country, one variety, near-total dominance
The U.S. imported 2.7 billion pounds of fresh avocados in calendar year 2025, on top of about 430 million pounds grown at home (almost all of that in California). Of those imports, Mexico shipped 2.24 billion pounds, or 83% of the total. The next 4 suppliers combined did not reach a fifth of Mexico's volume. Mexico ships 11 times as many avocados to the U.S. as the next-biggest source, Peru.
Almost every one of those Mexican avocados is the same variety: Hass. Hass traces to a single seedling that mail carrier Rudolph Hass planted in his La Habra Heights, California yard in 1926 and patented in 1935. A 2019 genetic study found the variety is roughly 61% Mexican and 39% Guatemalan ancestry. It now makes up about 95% of all U.S. avocado consumption.
It wasn't always this way
For most of the 20th century, no Mexican avocado could legally enter the country. The U.S. imposed a ban in 1914 over concerns about weevils, scabs, and other pests that could damage California orchards, and that ban held for almost 8 decades. It began to crack in 1993 with limited shipments to Alaska, then opened in stages through the rest of the 1990s and 2000s. Mexican Hass only got year-round access to all 50 states in 2007.
Before that, Chile was the giant. Through most of the 1990s, Chilean avocados accounted for more than 80% of U.S. imports. Once Mexico finally walked in the front door, the picture flipped almost overnight. Chile's share fell from over 80% in the 1990s to less than 1% by 2025. The U.S. avocado market we have today is barely 30 years old.
Why Michoacán wins
Mexican avocado exports to the U.S. are not a national effort. They come almost entirely from one state, Michoacán, with a smaller contribution from neighboring Jalisco. The USDA's March 2026 Mexico Avocado Annual reports that Michoacán alone produced 75% of Mexico's 2.73 million metric tons in 2025. The state sits in the Trans-Mexican Volcanic Belt, where well-draining volcanic soil covers about 80% of the planted area.
The geography gives Michoacán 4 overlapping blooming seasons in a single calendar year, which means somewhere in the state, an avocado is being harvested every week. That continuous supply is why U.S. grocery stores can keep Hass on the shelf 52 weeks a year with no visible seasonal gap. No other producing region in the world matches that combination of soil, elevation, climate, and bloom cycle at scale.
The risk of leaning so hard on one source
The flip side of that efficiency is fragility. In June 2024, the USDA paused every avocado and mango inspection in Michoacán for 10 days after 2 of its inspectors were assaulted and briefly held at a roadblock. A similar pause hit shipments in February 2022, days before the Super Bowl. Avocado growers in Michoacán have long reported extortion demands from cartels, sometimes thousands of dollars per acre, with the lucrative export trade as the obvious target.
Every disruption pushes wholesale prices up almost immediately, because no other supplier can scale fast enough to plug the gap. You can see the market slowly hedging in the year-over-year numbers: Mexico held 89% of U.S. import volume in 2023, dropped to 87.6% in 2024, and sat at 83% by the end of 2025. Most of that lost share went to Peru and Colombia.
Where the other 17% comes from
Peru is the seasonal complement. Its harvest runs March through August, exactly when Mexican supply hits its annual low. About 86% of Peru's export crop sits along its dry Pacific coast under intensive drip irrigation, a fundamentally different growing environment than Michoacán's volcanic highlands.
Colombia is the fastest-growing supplier, jumping from a rounding error a decade ago to 4.6% of U.S. imports in 2025. Its biggest gains land in the weeks before the Super Bowl and Cinco de Mayo, exactly when Mexican supply tightens. The Dominican Republic plays a different game entirely. About 80% of its U.S. shipments are non-Hass varieties, the larger green-skin fruit that competes for a different shelf rather than going head-to-head with Hass. And Chile, once the giant, now ships about 22 million pounds a year to the U.S., mostly into West Coast retail at the margins of the season.
How this chart was made
An AI agent built this chart end-to-end as part of the Beautiful Charts with AI series. It pulled the data, built the chart in Python, and iterated on the design until it passed the Tufte Test, a data visualization quality standard from Goodeye Labs. The workflow behind it is public: run the same high-signal chart workflow to make your own.
Data source: U.S. Census Bureau, USA Trade in Goods, harmonized tariff codes 0804.40.0040 (Hass) and 0804.40.0090 (Other), 2025 calendar year. The full dataset used for this chart is available here.
Beautiful Charts with AI
Make your own charts with the same workflow
Every chart in this series is built by the same public workflow. Fork it and run it yourself, then grade the result against the Tufte Test.

Dr. Randal S. Olson
AI Researcher & Builder · Co-Founder & CTO at Goodeye Labs
I’ve worked in AI for 15+ years. At Goodeye Labs, we build AI products that point frontier models at the business outcomes a team actually cares about.