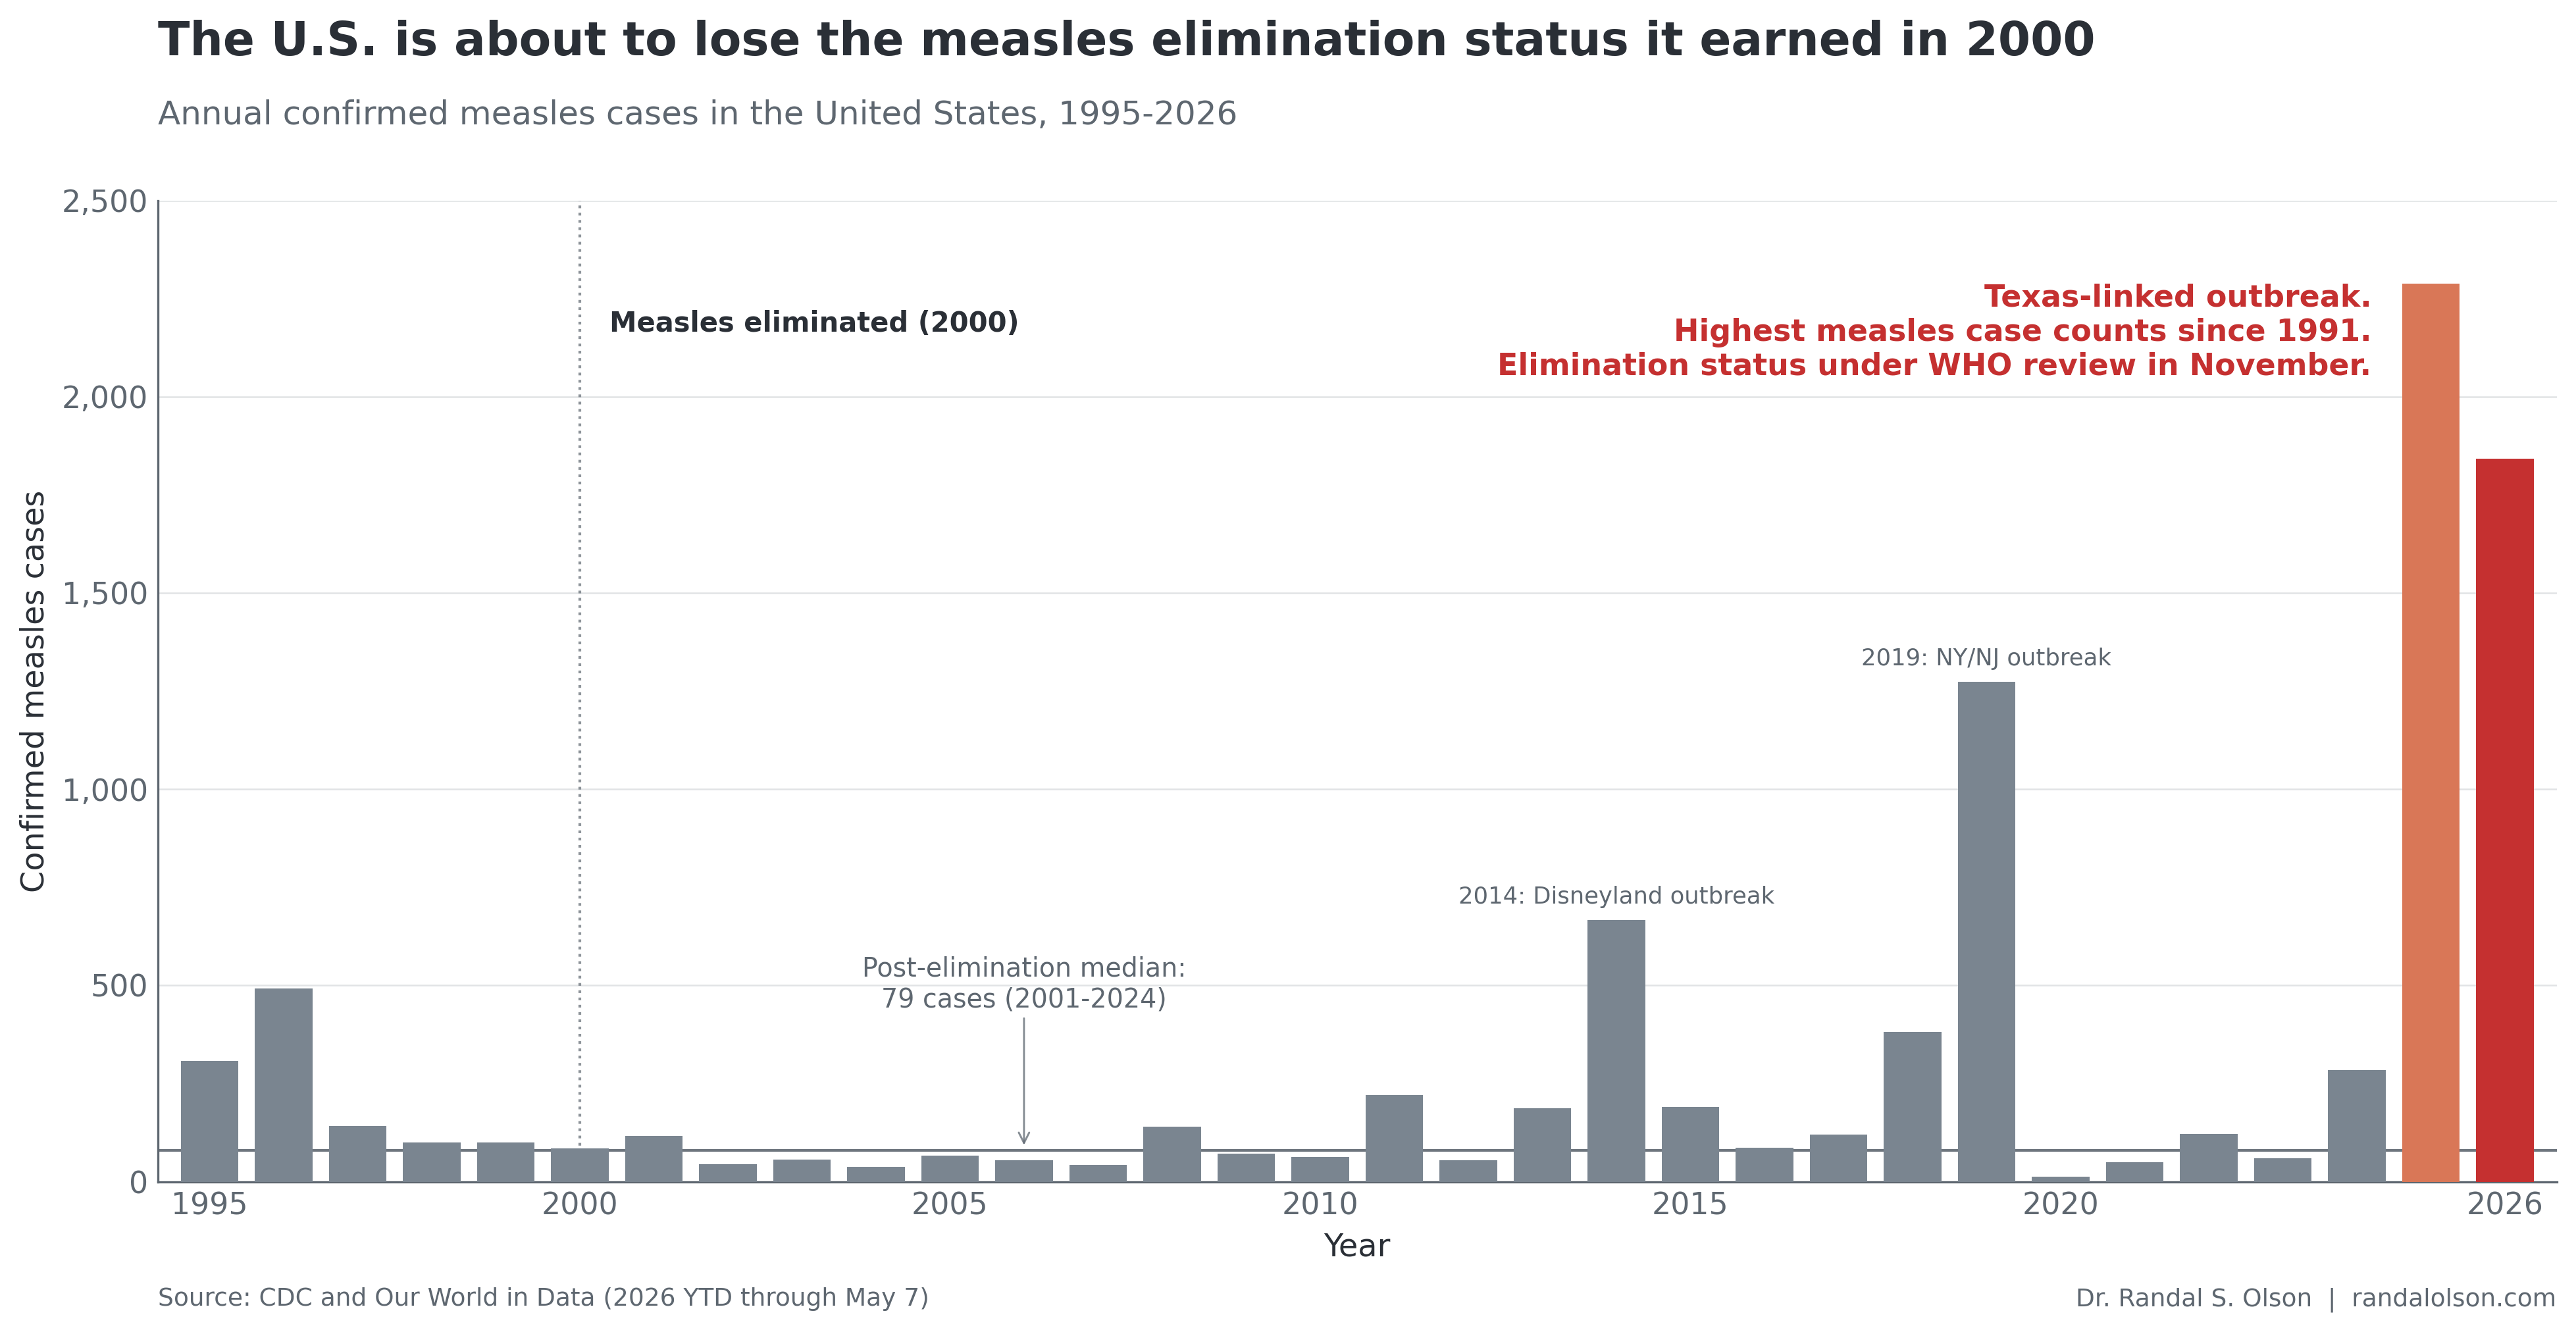
U.S. measles cases broke the post-elimination floor in 2025 and 2026
Part of Teaching an AI Agent to Make Beautiful Charts
In 2000, the U.S. did something hard: it stopped measles. Endemic transmission halted, and for the next 24 years the country averaged 79 confirmed cases annually, almost all of them imported by travelers and stamped out before they spread. That run is over. 2025 brought 2,288 cases, the worst year since 1991. 2026 is already at 1,842 with 2/3 of the year still ahead. The elimination status the U.S. earned a generation ago is up for WHO review this November.
The post-elimination floor barely moved for 24 years
From 2001 through 2024, the median U.S. year saw 79 measles cases, and 19 of those 24 years came in under 200. The CDC and PAHO declared measles eliminated in 2000 because the country had stopped having sustained domestic transmission chains. WHO defines elimination as the absence of any chain that lasts 12 months or longer. That low post-2000 baseline is what elimination looks like in practice: sporadic imported cases that fizzle before they spread.
2014 and 2019 were shocks that didn't break the floor
The 2014 and 2019 outbreaks pushed cases above the baseline but never threatened elimination status. The 2014-15 Disneyland outbreak infected 147 people across 7 states. 45% of California patients were unvaccinated, and 67% of the vaccine-eligible patients were intentionally unvaccinated. California responded by passing SB 277 in 2015, which ended personal-belief exemptions for school enrollment.
The 2019 New York and New Jersey outbreak was larger and more concentrated. 1,274 cases nationally, with 93% of New York City cases in the Orthodox Jewish community and 73% of patients residing in Williamsburg, Brooklyn. The median patient age was 3. NYC Mayor de Blasio declared a public health emergency on April 9, 2019, and New York repealed its religious vaccination exemption in June. Both years cleared the chain before the 12-month elimination clock ran out.
2025 and 2026 are the West Texas chain
The 2025 surge started in Gaines County, Texas, a Mennonite community where roughly 20% of kindergartners claim a vaccine exemption compared to the state average of less than 4%, per Texas Tribune reporting. By March 2025 the outbreak had spread across the Southwest, eventually killing 2 unvaccinated children in Texas and 1 unvaccinated adult in New Mexico, the first U.S. measles deaths in a decade.
The CDC's May 7, 2026 update counts 1,842 cases across 39 jurisdictions, with 92% of patients unvaccinated or of unknown vaccination status. The Texas-linked transmission that started in January 2025 is what puts elimination status in question. WHO defines elimination as the absence of a transmission chain lasting 12 months or longer, and the Region of the Americas measles commission will assess the U.S. at its next annual meeting.
National MMR coverage has dropped below the herd immunity threshold
The West Texas chain caught hold because national vaccination coverage is no longer enough to prevent local outbreaks from spreading. CDC's SchoolVaxView shows kindergarten MMR coverage fell to 92.5% in the 2024-25 school year, down from 95% pre-pandemic and below the Healthy People 2030 target of 95% needed to prevent community transmission. 39 states now sit below the 95% threshold, up from 28 before the pandemic.
Vaccine exemptions, almost all non-medical, rose to a record 3.6% of kindergartners in 2024-25. That works out to roughly 286,000 unvaccinated kindergartners nationally. Pockets of much lower coverage drive most of the risk: Idaho's statewide kindergarten MMR rate is 78.5%, and individual counties run lower than that.
What losing elimination status would actually mean
The Region of the Americas measles commission already lost its regional elimination status in November 2025, after Canada's outbreak chain crossed 12 continuous months. The U.S. retained its country-level status at that meeting and faces its next assessment in November 2026. If the Texas-linked chain that started in January 2025 has not been definitively interrupted, the U.S. will join Canada.
Losing the designation does not change daily clinical guidance. MMR is still the recommended vaccine, exposures are still reported to the CDC, and outbreak response still runs through local health departments. What changes is the global label. Elimination is recoverable. The United Kingdom lost its status in 2019, regained it in 2021 when COVID restrictions suppressed transmission, and lost it again in early 2026 after cases rebounded through 2024. Brazil lost elimination in 2019 and earned it back in 2024 after 5 years of sustained vaccination work.
The November review will just label what the chart already shows. What changes next year's chart is whether kindergarten MMR coverage climbs back above 95%.
How this chart was made
An AI agent built this chart end-to-end as part of the Beautiful Charts with AI series. It pulled CDC annual measles case counts via Our World in Data, computed the 2001-2024 post-elimination median, rendered the result as a bar chart with that empirical baseline drawn directly on the plot, and iterated on the design until it passed the Tufte Test, a data visualization quality standard from Goodeye Labs. The workflow behind it is public: run the same high-signal chart workflow to make your own.
Data source: U.S. Centers for Disease Control and Prevention measles case counts, mirrored by Our World in Data. The 2026 figure is year-to-date through May 7 per the CDC's latest update. The CSV used for this chart is available here.
Beautiful Charts with AI
Make your own charts with the same workflow
Every chart in this series is built by the same public workflow. Fork it and run it yourself, then grade the result against the Tufte Test.

Dr. Randal S. Olson
AI Researcher & Builder · Co-Founder & CTO at Goodeye Labs
I’ve worked in AI for 15+ years. At Goodeye Labs, we build AI products that point frontier models at the business outcomes a team actually cares about.