NOAA's hurricane outlook misses one way: it underforecasts big seasons
Part of Teaching an AI Agent to Make Beautiful Charts
On Thursday, May 21, NOAA will announce how many storms it expects in the 2026 Atlantic hurricane season, 11 days before the season officially starts on June 1. Since 2003, the actual named-storm count has landed inside NOAA's May predicted range about 6 years in 10. When it missed, it almost always missed the same way: the season was busier than NOAA called for.
The forecast misses in one direction
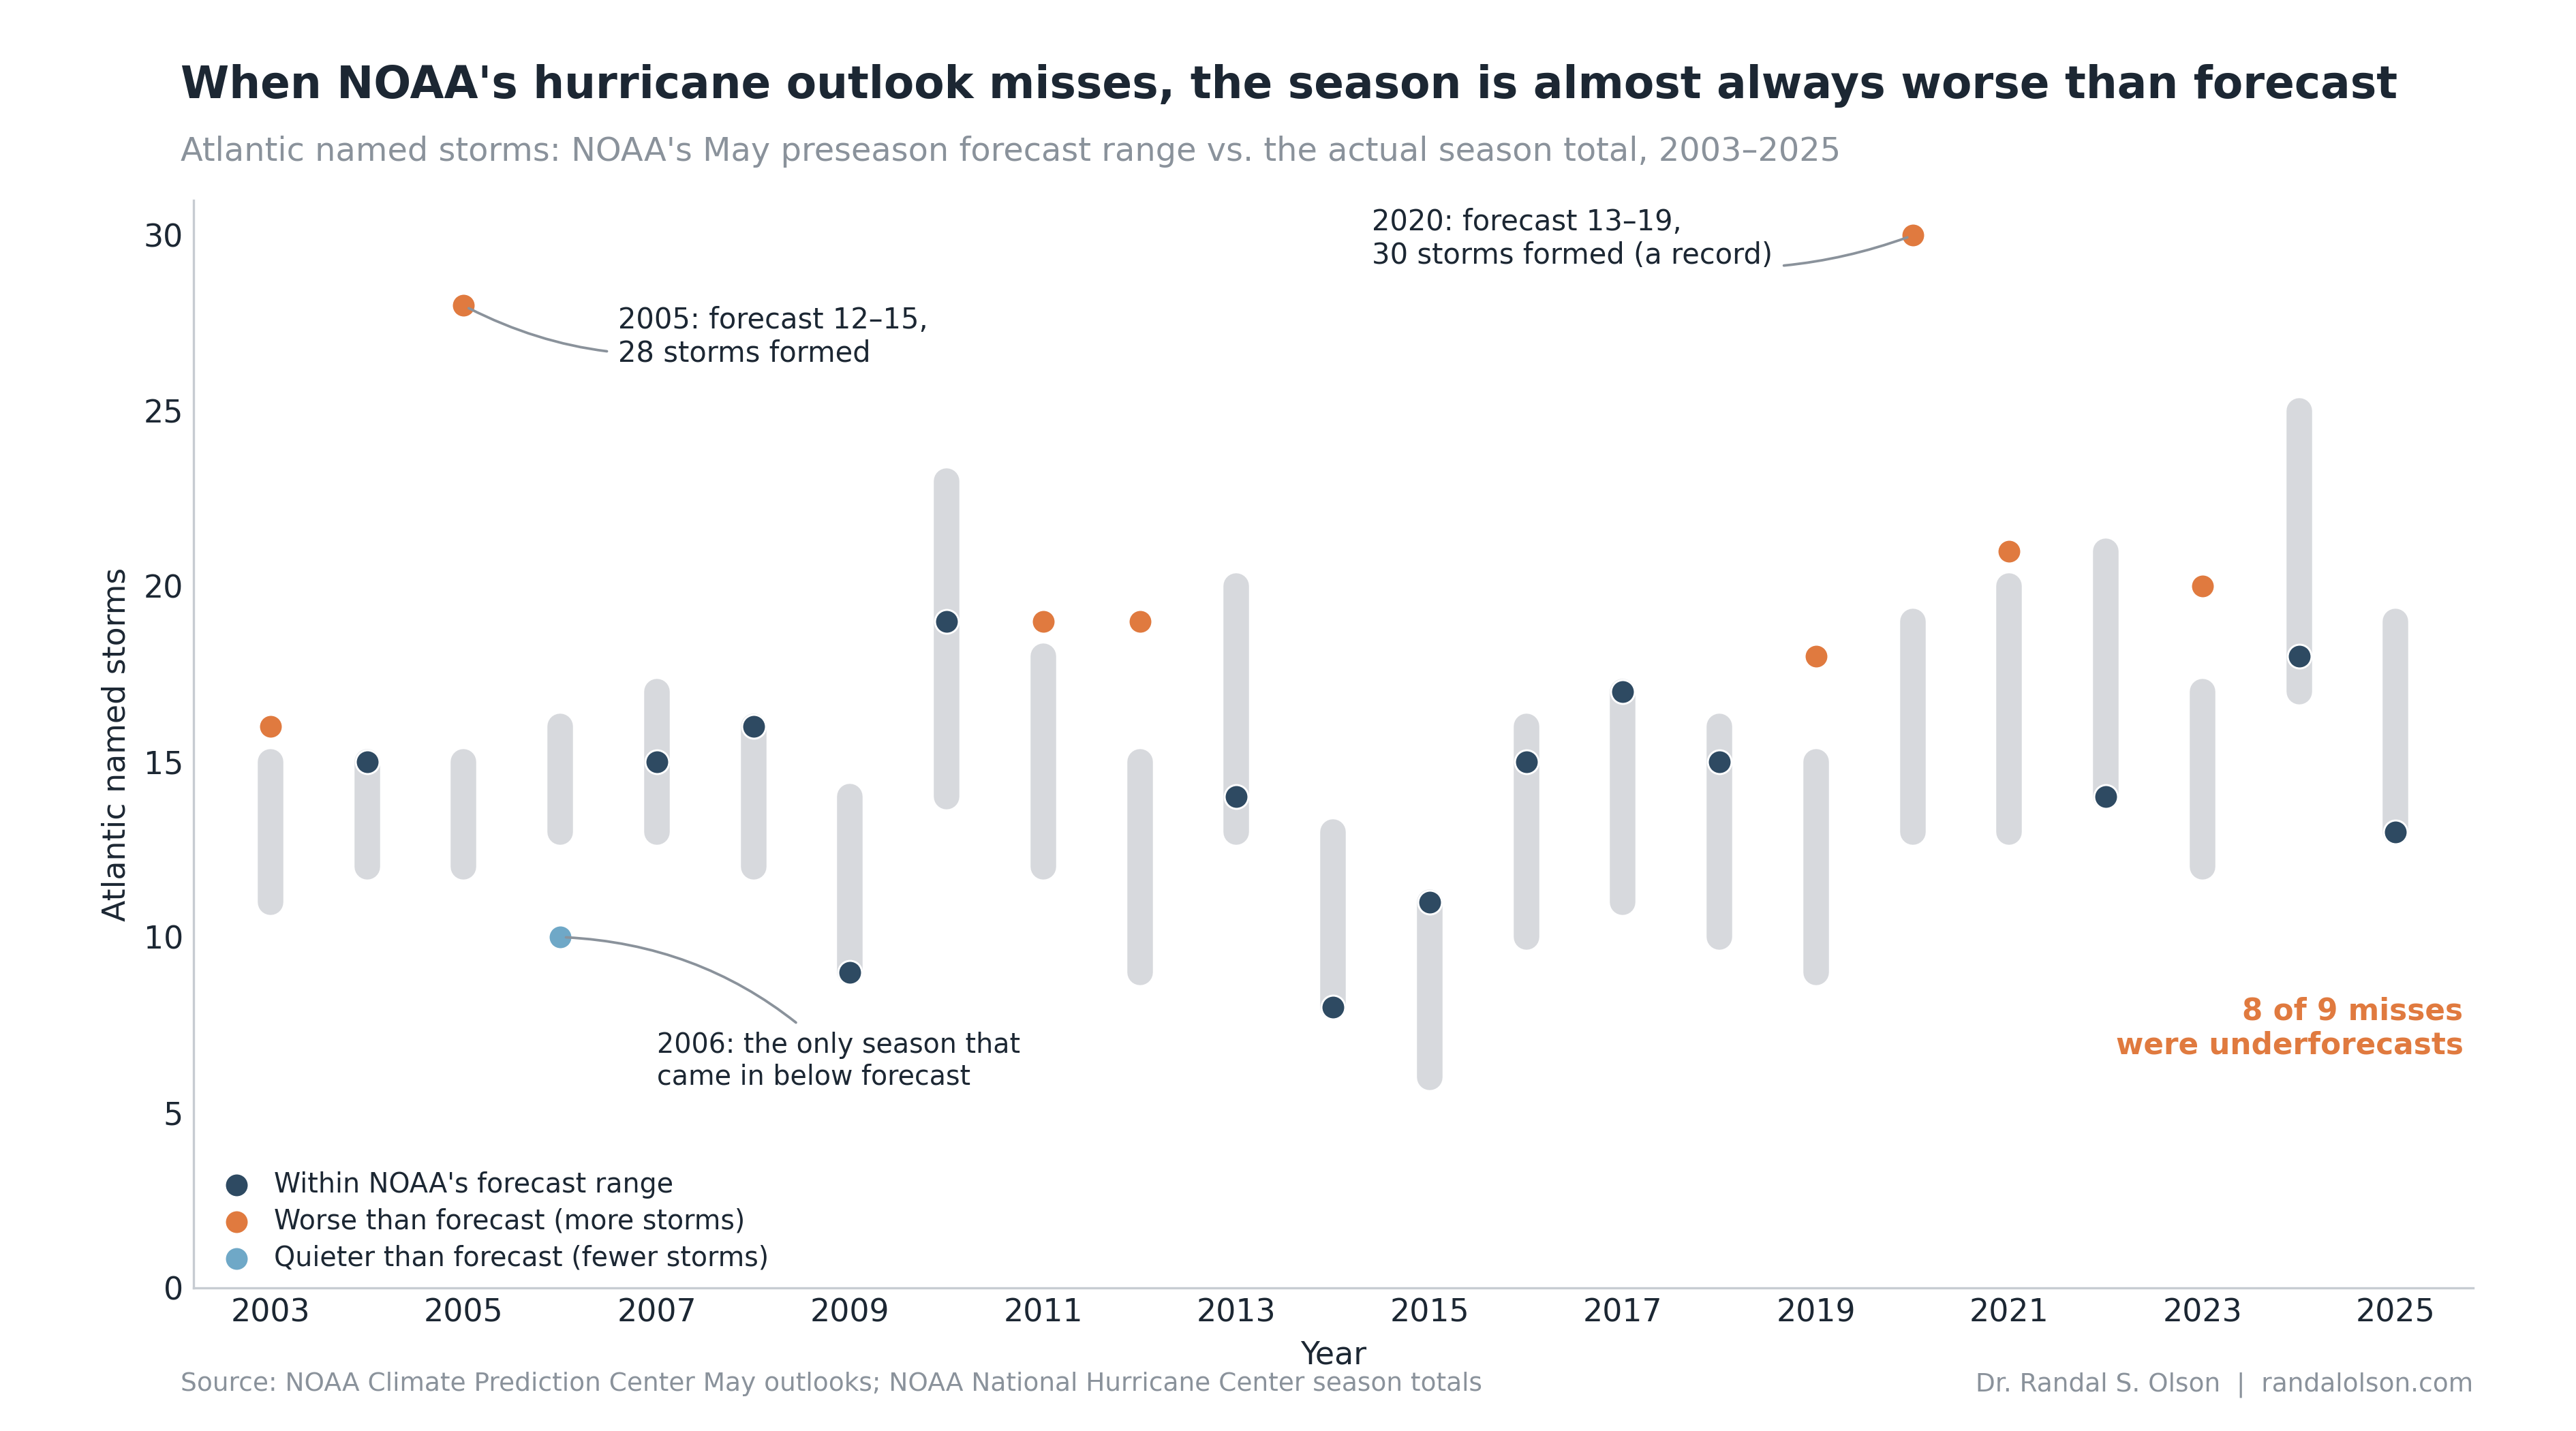
Across the 23 seasons from 2003 through 2025, the actual total landed inside NOAA's May named-storm range 14 times. Of the 9 years it missed, 8 were underforecasts: the season produced more storms than the top of NOAA's range. Only 2006 went the other way. NOAA states that activity should fall within each predicted range in about 70% of seasons with similar conditions. For named storms, the observed hit rate is closer to 61%, and the shortfall is almost entirely seasons that turned out busier than predicted.
When NOAA's May outlook is wrong, the season is almost always worse than forecast, not quieter. The error has a consistent sign: the years NOAA missed were the hyperactive ones, not the quiet ones.
2005: forecast 12 to 15, then 28 storms
NOAA's May 2005 outlook called for 12 to 15 named storms and a 70% chance of an above-normal season. The season delivered 28, the most on record at the time, including Katrina, Rita, and Wilma. NOAA's own post-season assessment pinned the explosion on tropical-Atlantic sea-surface temperatures reaching an 1870 to 2005 record, La Nina-like patterns in the Pacific, and exceptionally weak wind shear, all stacked on top of the active era that began in 1995.
By early August 2005, NOAA had revised its outlook up to 18 to 21 named storms. The season still came in nearly double the top of the May range.
2020: the record NOAA didn't see in May
The May 2020 outlook predicted 13 to 19 named storms with a 60% chance of an above-normal season. The Atlantic produced 30, a new record. The biggest driver was the warmest Atlantic sea-surface temperatures on record, compounded by a developing La Nina that cut wind shear and an enhanced West African monsoon.
In August, NOAA escalated to an "extremely active" call of 19 to 25 named storms, the first time it had ever forecast as many as 25. Even the dramatically raised August ceiling still came in 5 storms short of the 30 that formed.
2006: the only year the forecast was too high
2006 is the lone dot below its forecast bar. NOAA's May 2006 outlook called for 13 to 16 named storms and an 80% chance of an above-normal season. Only 10 formed. A moderate El Nino developed rapidly and unexpectedly in late summer, ramping up wind shear, while a dry, dust-laden Saharan Air Layer suppressed activity through August, per Tropical Storm Risk's season verification and the season summary.
The single overforecast in 23 years came from an El Nino that arrived faster than the May outlook assumed. That is the same lever, ENSO, that drives the underforecasts, just pulled in the opposite direction.
Why the misses run the same way
The structural reason sits in the calendar. NOAA issues the outlook in May, but spring is the worst time of year to predict El Nino and La Nina: forecast models hit what NOAA's Climate Prediction Center calls the spring predictability barrier, explaining less than a third of ENSO variability from an April vantage point. NOAA's own verification work shows the May outlook has little statistical skill, while the August update is far more accurate once the season's drivers are locked in.
The bias toward underforecasting is the active era showing through. Since 1995 the Atlantic has been in a high-activity phase, so when a forecaster anchors near a moderate May midpoint and conditions turn favorable, there is far more room to blow past the top of the range than to fall below the bottom of it. The downside risk on these forecasts is one-directional.
What the 2026 outlook is up against
Colorado State University's April 2026 forecast calls for a somewhat below-normal season: 13 named storms, 6 hurricanes, and 2 major hurricanes, with overall activity around 75% of the long-term average. The reasoning is a weak La Nina expected to flip to a moderate or strong El Nino, which raises Atlantic wind shear, paired with a mixed sea-surface-temperature pattern.
NOAA's official 2026 numbers arrive May 21. A below-normal call has historically been the safer kind to make, but 2005 and 2020 show the rare big miss has almost always run the other way: a season far worse than the May outlook, not quieter.
How this chart was made
An AI agent built this chart end-to-end as part of the Beautiful Charts with AI series. It compiled NOAA's May preseason forecast ranges and the National Hurricane Center's end-of-season totals for 2003 through 2025, classified each year as within, above, or below the forecast range, and iterated on the design until it passed the Tufte Test, a data visualization quality standard from Goodeye Labs. The workflow behind it is public: run the same high-signal chart workflow to make your own.
Data source: NOAA Climate Prediction Center May Atlantic hurricane outlooks for the forecast ranges and NOAA National Hurricane Center season totals for the actuals. This analysis covers 2003 through 2025, the period over which NOAA's May outlook consistently stated an explicit predicted range for the upcoming season; earlier outlooks (2000 to 2002) framed activity in probabilistic terms and are not included. The CSV used for this chart is available here.
Beautiful Charts with AI
Make your own charts with the same workflow
Every chart in this series is built by the same public workflow. Fork it and run it yourself, then grade the result against the Tufte Test.

Dr. Randal S. Olson
AI Researcher & Builder · Co-Founder & CTO at Goodeye Labs
I’ve worked in AI for 15+ years. At Goodeye Labs, we build AI products that point frontier models at the business outcomes a team actually cares about.