Inflation worry flipped party lines while inflation itself barely moved
Part of Teaching an AI Agent to Make Beautiful Charts
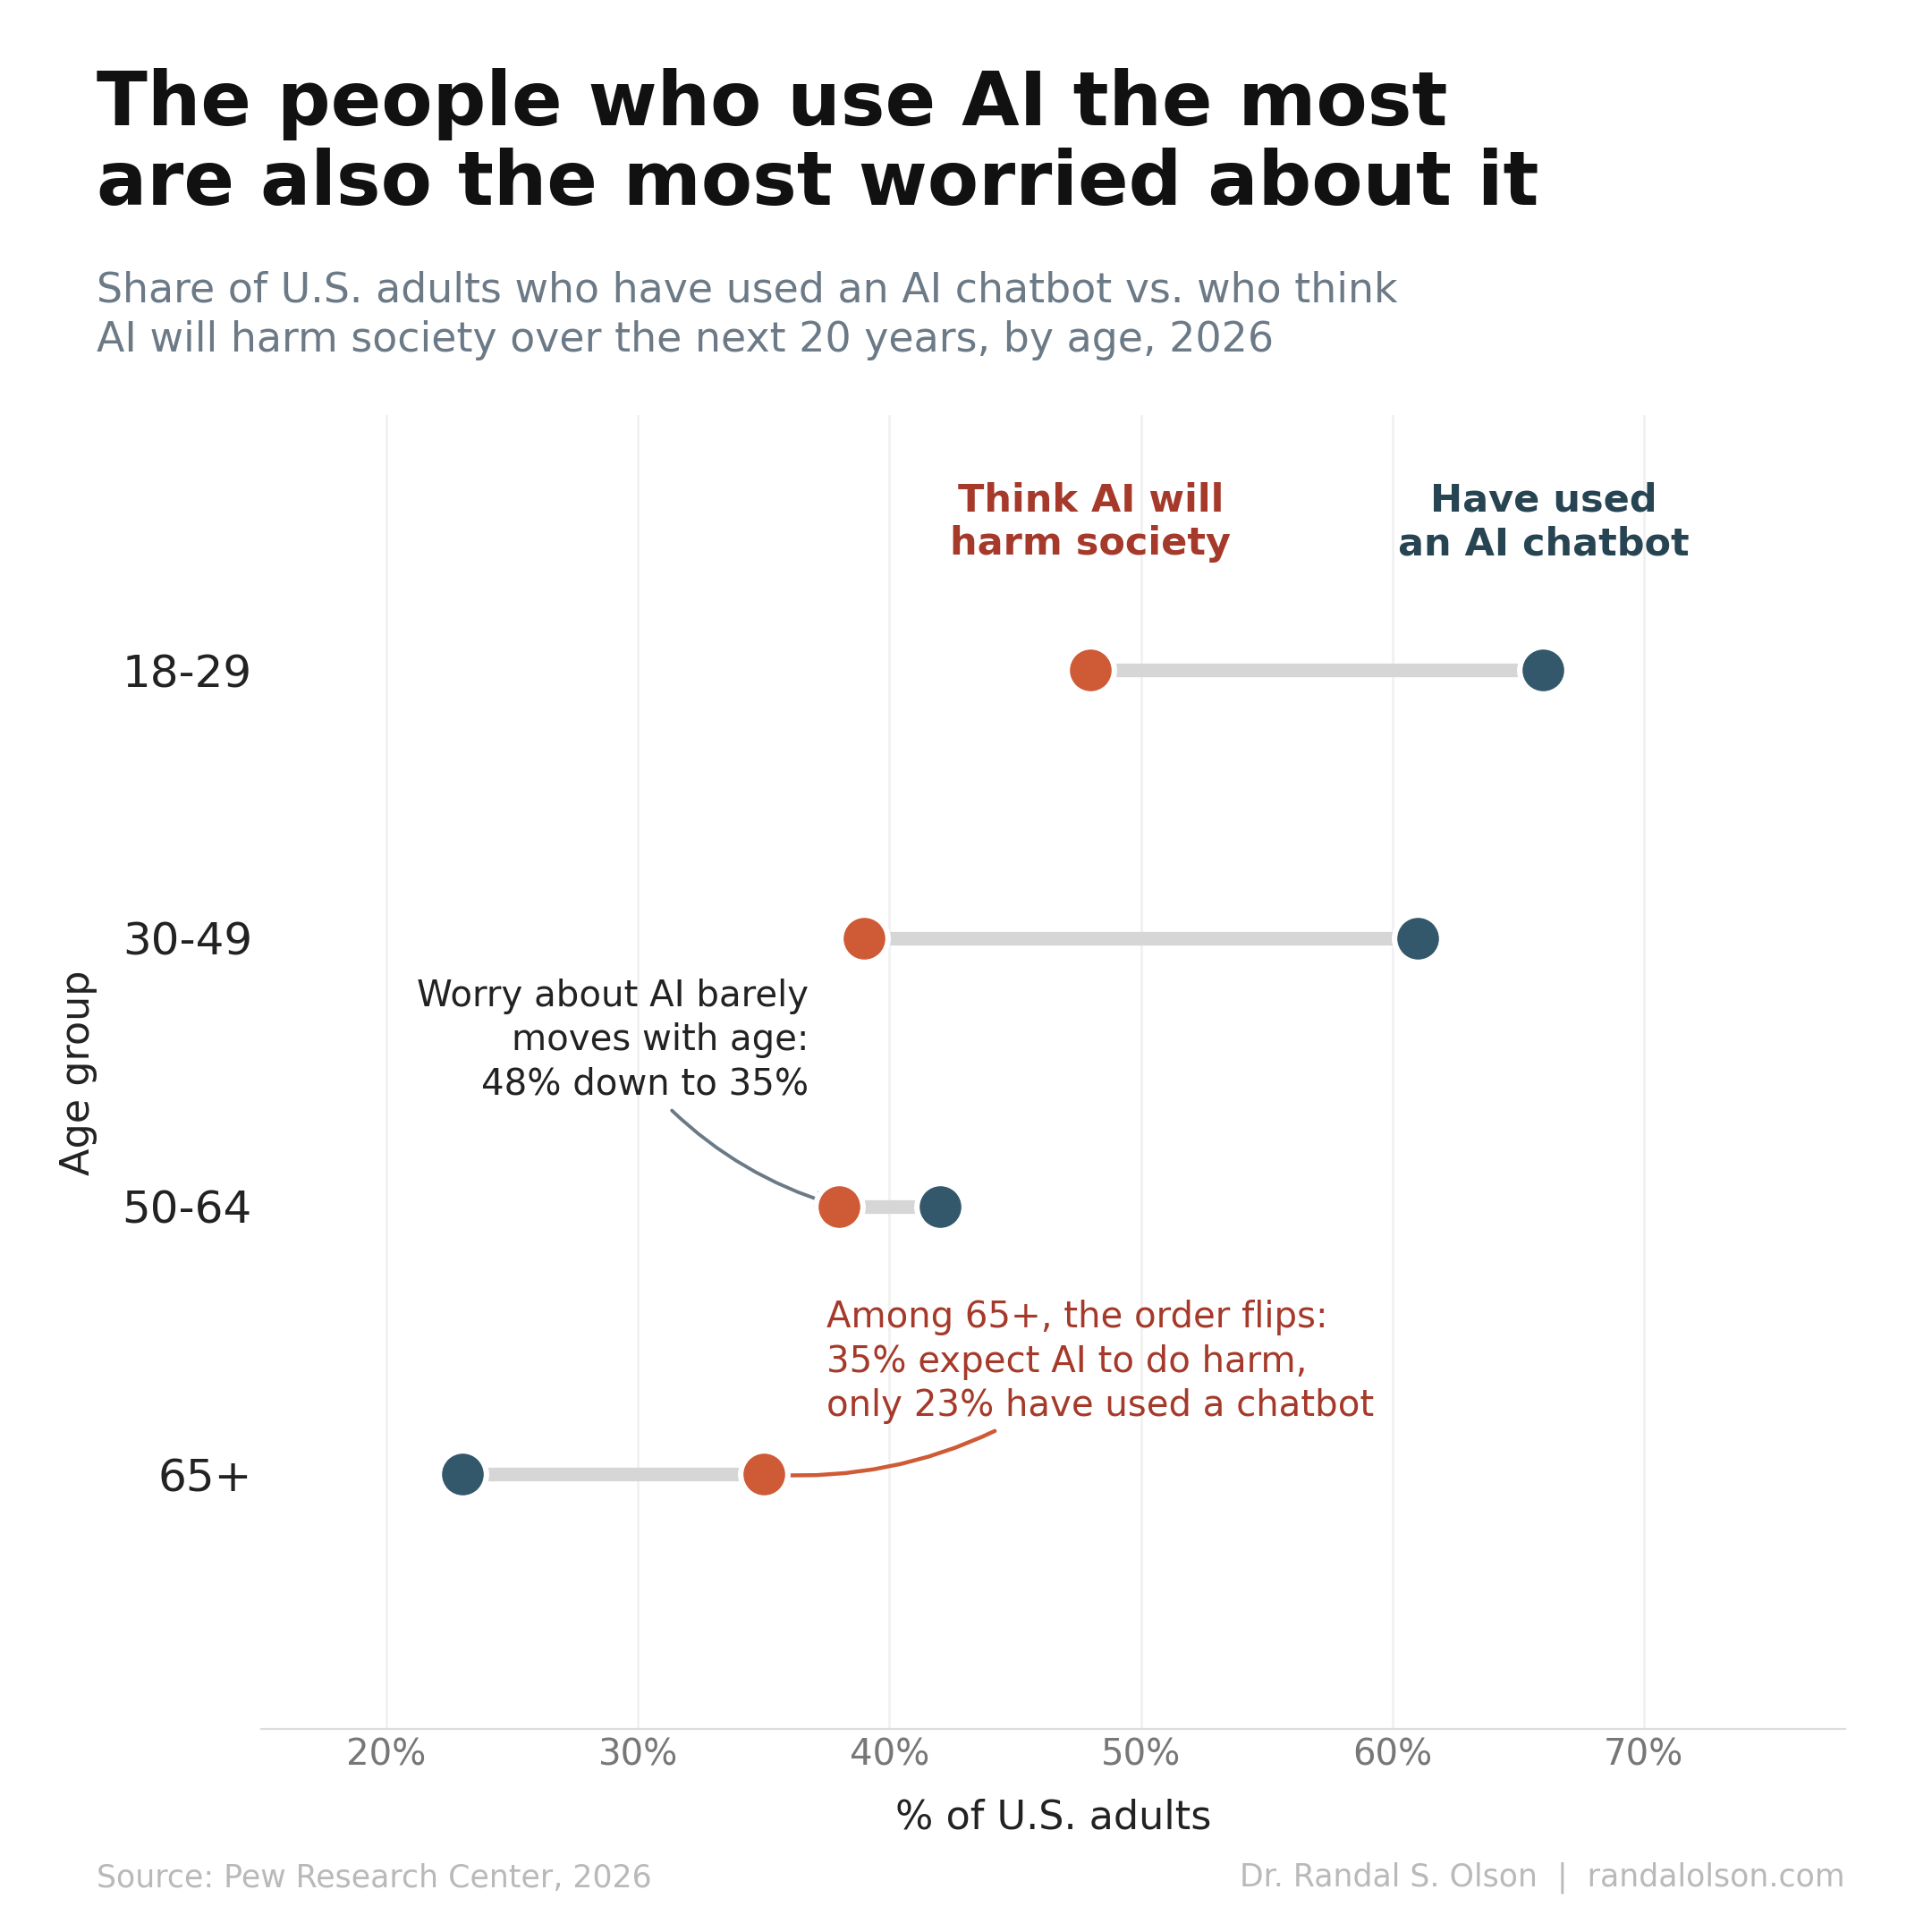
In May 2024, 6 months before the presidential election, 80% of Republicans and 46% of Democrats told Pew Research that inflation was a "very big problem" facing the country. In April 2026, 15 months into Trump's second term, the 2 numbers are 55% and 74%. The parties traded places. Headline inflation in that window moved from 3.3% to 3.8%.
In 2022, both parties' worry rose with inflation
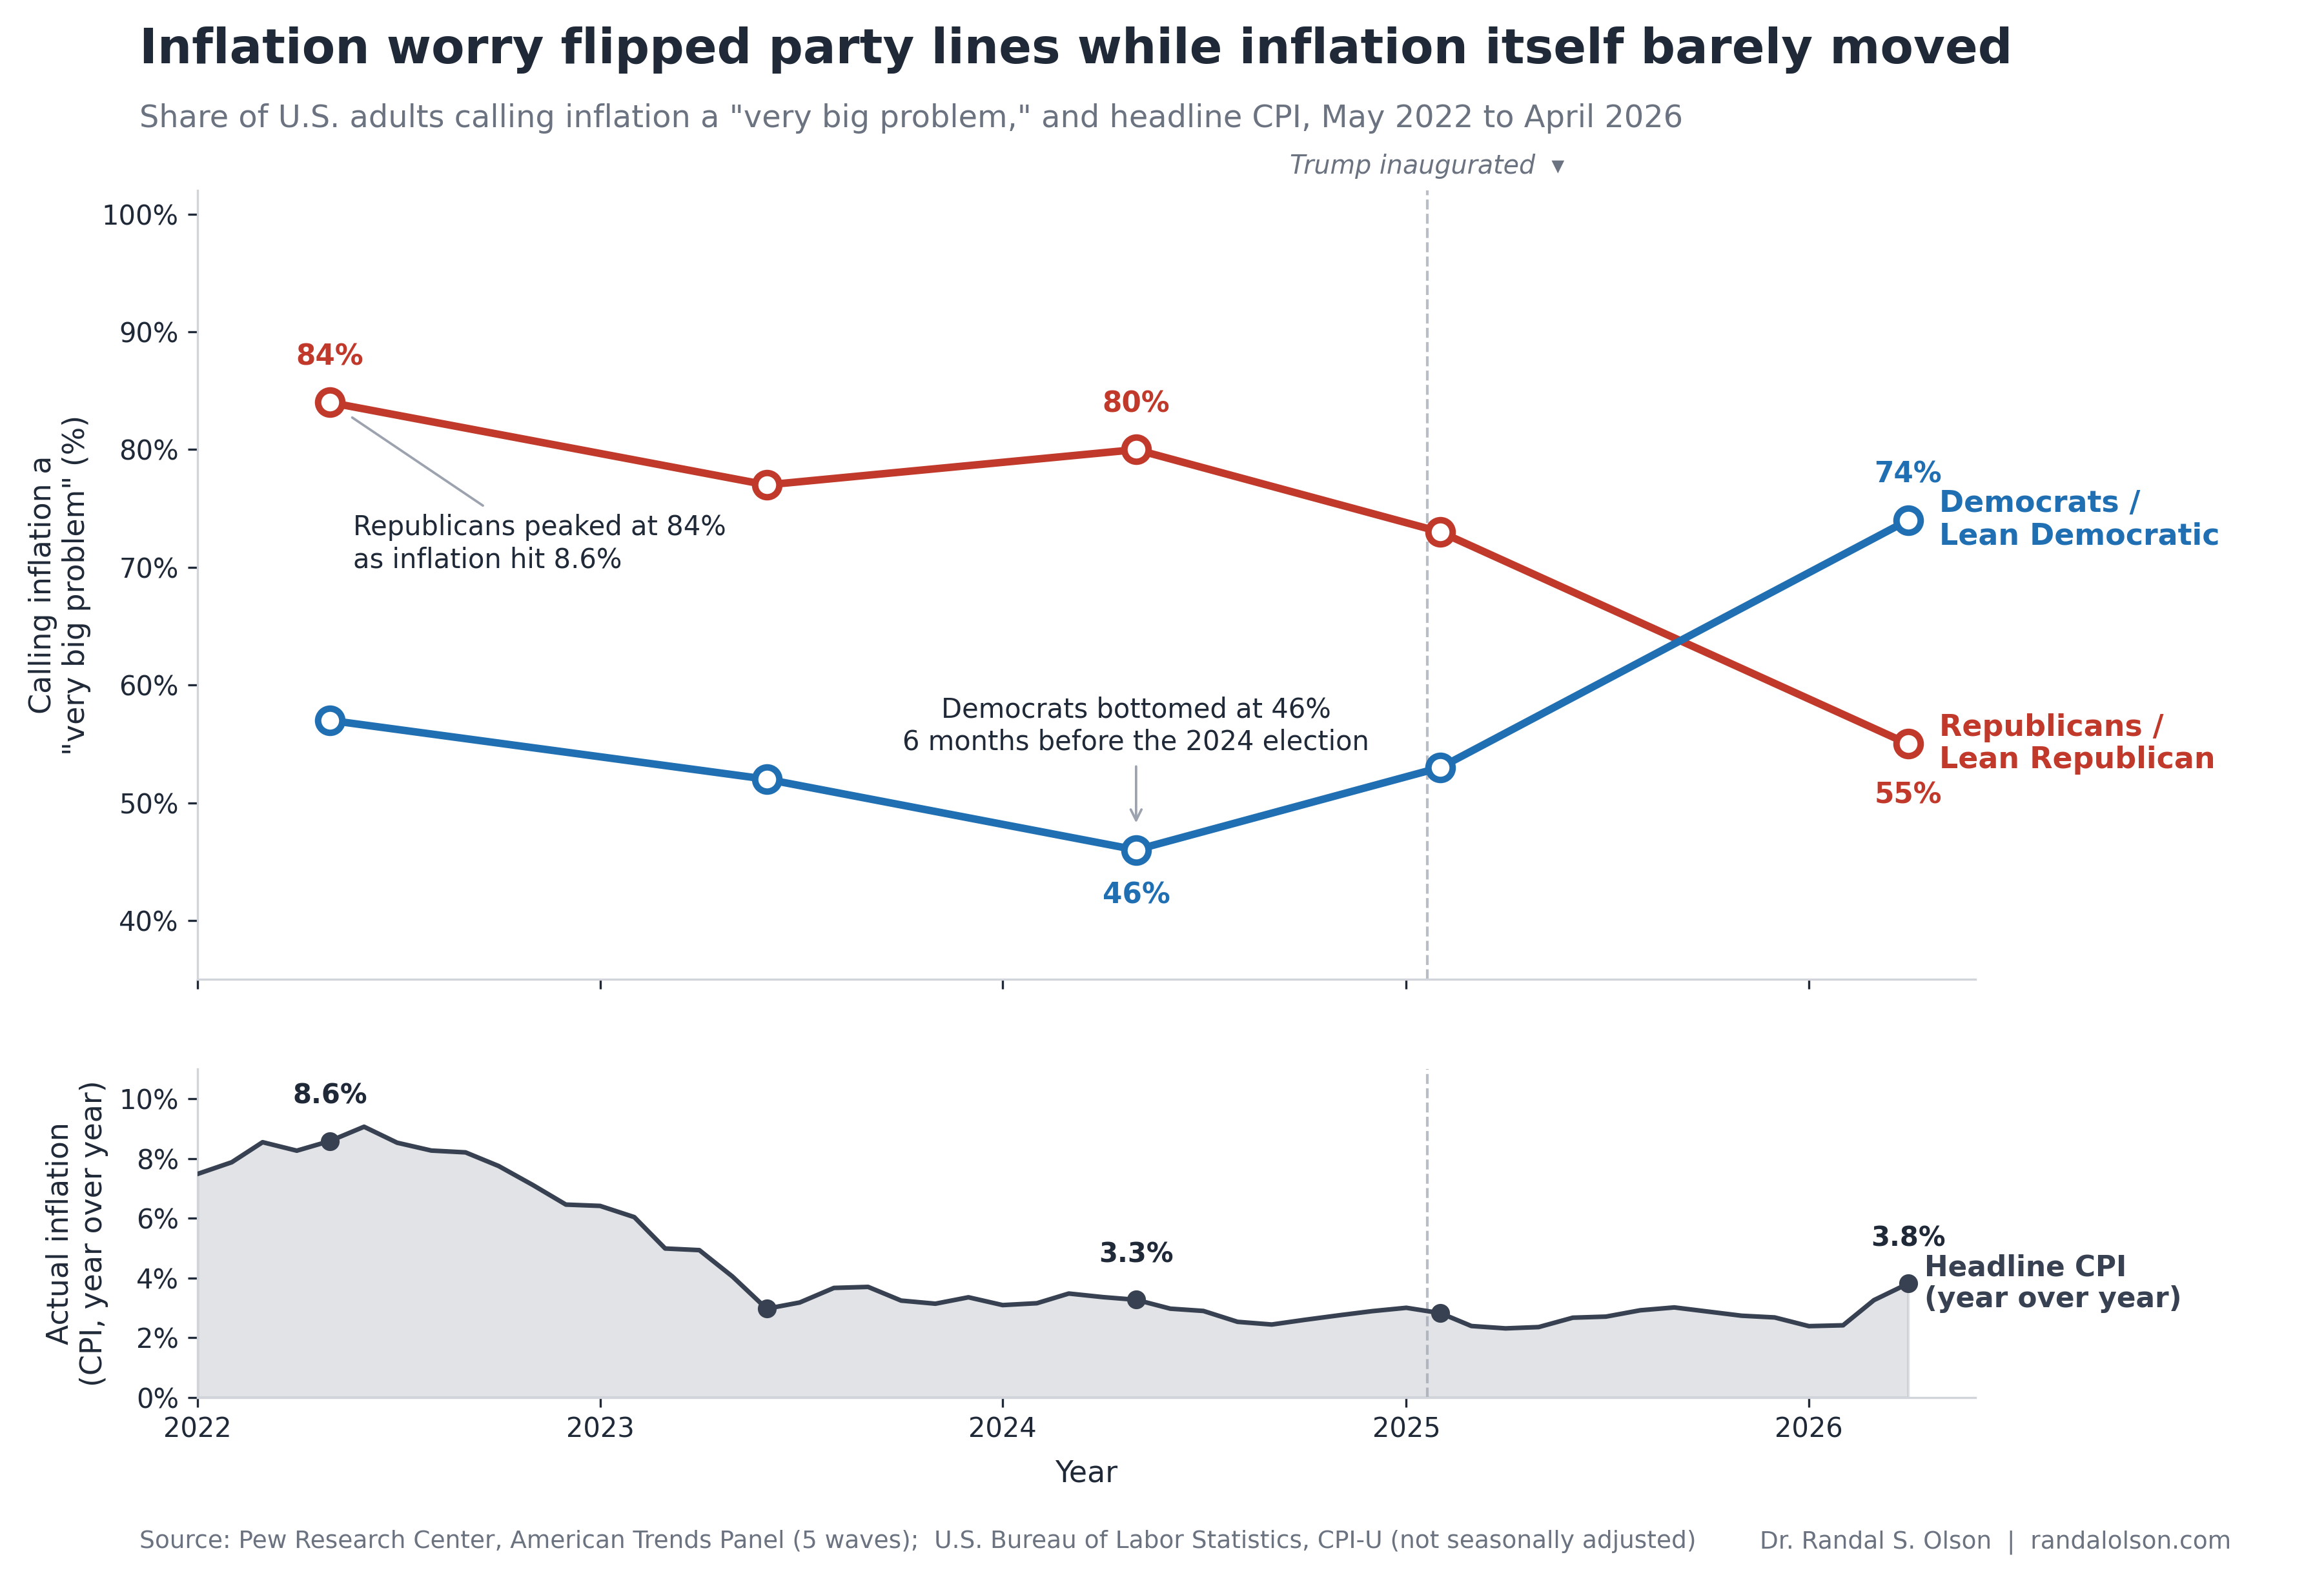
When Pew first asked the question in May 2022, U.S. headline CPI was at 8.6% year over year and climbing toward a June 2022 peak of 9.1%. Republicans hit 84% and Democrats hit 57%, both their highest readings of the series. The 27-point partisan gap was already there. This is the only wave where both parties' worry and the actual inflation rate move in the same direction. In every subsequent wave, partisan worry and inflation pull apart.
By 2024, the gap widened as inflation cooled
From May 2022 to May 2024, CPI fell from 8.6% to 3.3%, a 5.3 point drop that brought inflation closer to the Fed's 2% target. Republican worry fell 4 points, from 84% to 80%. Democratic worry fell 11 points, from 57% to 46%. The partisan gap widened from 27 points to 34 points as the actual problem shrank.
The lines crossed within a year of Trump taking office
The next wave landed in February 2025, 2 weeks after the inauguration. Republican worry was at 73%, down 7 points from May 2024. Democratic worry was at 53%, up 7 points from May 2024. By April 2026 the crossover was complete: 55% of Republicans and 74% of Democrats called inflation a very big problem. From May 2024 to April 2026, Republican worry fell 25 points and Democratic worry rose 28 points. That is a 53 point swing in 2 years.
Inflation did rise during the Trump months. CPI climbed from 2.8% in February 2025 to 3.8% in April 2026, the highest reading since May 2023. Gas prices jumped 50% after the war with Iran started, and tariffs on Mexican produce pushed tomato prices up roughly 40% year over year. Over the same window as the 53-point partisan swing, headline CPI rose half a percentage point.
Inflation itself barely moved
The bottom panel tells the part of the story the perception lines do not. Between the May 2024 Pew wave and the April 2026 wave, headline CPI moved half a percentage point. CPI went from 8.6% down to 3.3% during Biden's term, then back up to 3.8% in Trump's first 15 months. The Trump-era inflation level looks a lot like the late-Biden inflation level. What changed is who is in office. The number did not.
This is what partisan motivated reasoning looks like
Political scientists have been documenting this pattern for decades. Brady, Ferejohn, and Parker's 2022 paper finds that partisan bias in U.S. economic perceptions has grown substantially over the past 20 years, with supporters of the in-party rating the economy far more favorably than supporters of the out-party even after controlling for actual conditions.
The most recent precedent is from 2017. Gallup's Economic Confidence Index showed Republicans jumping 77 points and Democrats dropping 38 points in the year after Trump's first inauguration, with the underlying economy barely changed. Pew's inflation question is the same phenomenon on a different topic and a different year. When the party in the White House changes, the perception of the economy changes with it, even when the data does not.
How this chart was made
An AI agent built this chart end-to-end as part of the Beautiful Charts with AI series. It pulled the Pew Research National Problems waves from May 2022 through April 2026, computed headline CPI year-over-year changes from the BLS CPI-U series, rendered the 2 metrics as stacked time-aligned panels, and iterated on the layout until it passed the Tufte Test, a data visualization quality standard from Goodeye Labs. The workflow behind it is public: run the same high-signal chart workflow to make your own.
Data sources: Pew Research Center, "Americans See Health Care Costs, Inflation as Big Problems" (American Trends Panel Wave 192, fielded April 20-26, 2026, n=5,103); FRED CPIAUCNS, the U.S. Bureau of Labor Statistics Consumer Price Index for All Urban Consumers, not seasonally adjusted. The CSV used for this chart is available here.
Beautiful Charts with AI
Make your own charts with the same workflow
Every chart in this series is built by the same public workflow. Fork it and run it yourself, then grade the result against the Tufte Test.

Dr. Randal S. Olson
AI Researcher & Builder · Co-Founder & CTO at Goodeye Labs
I’ve worked in AI for 15+ years. At Goodeye Labs, we build AI products that point frontier models at the business outcomes a team actually cares about.