1 in 5 U.S. registered nurses are now 65 or older
Part of Teaching an AI Agent to Make Beautiful Charts
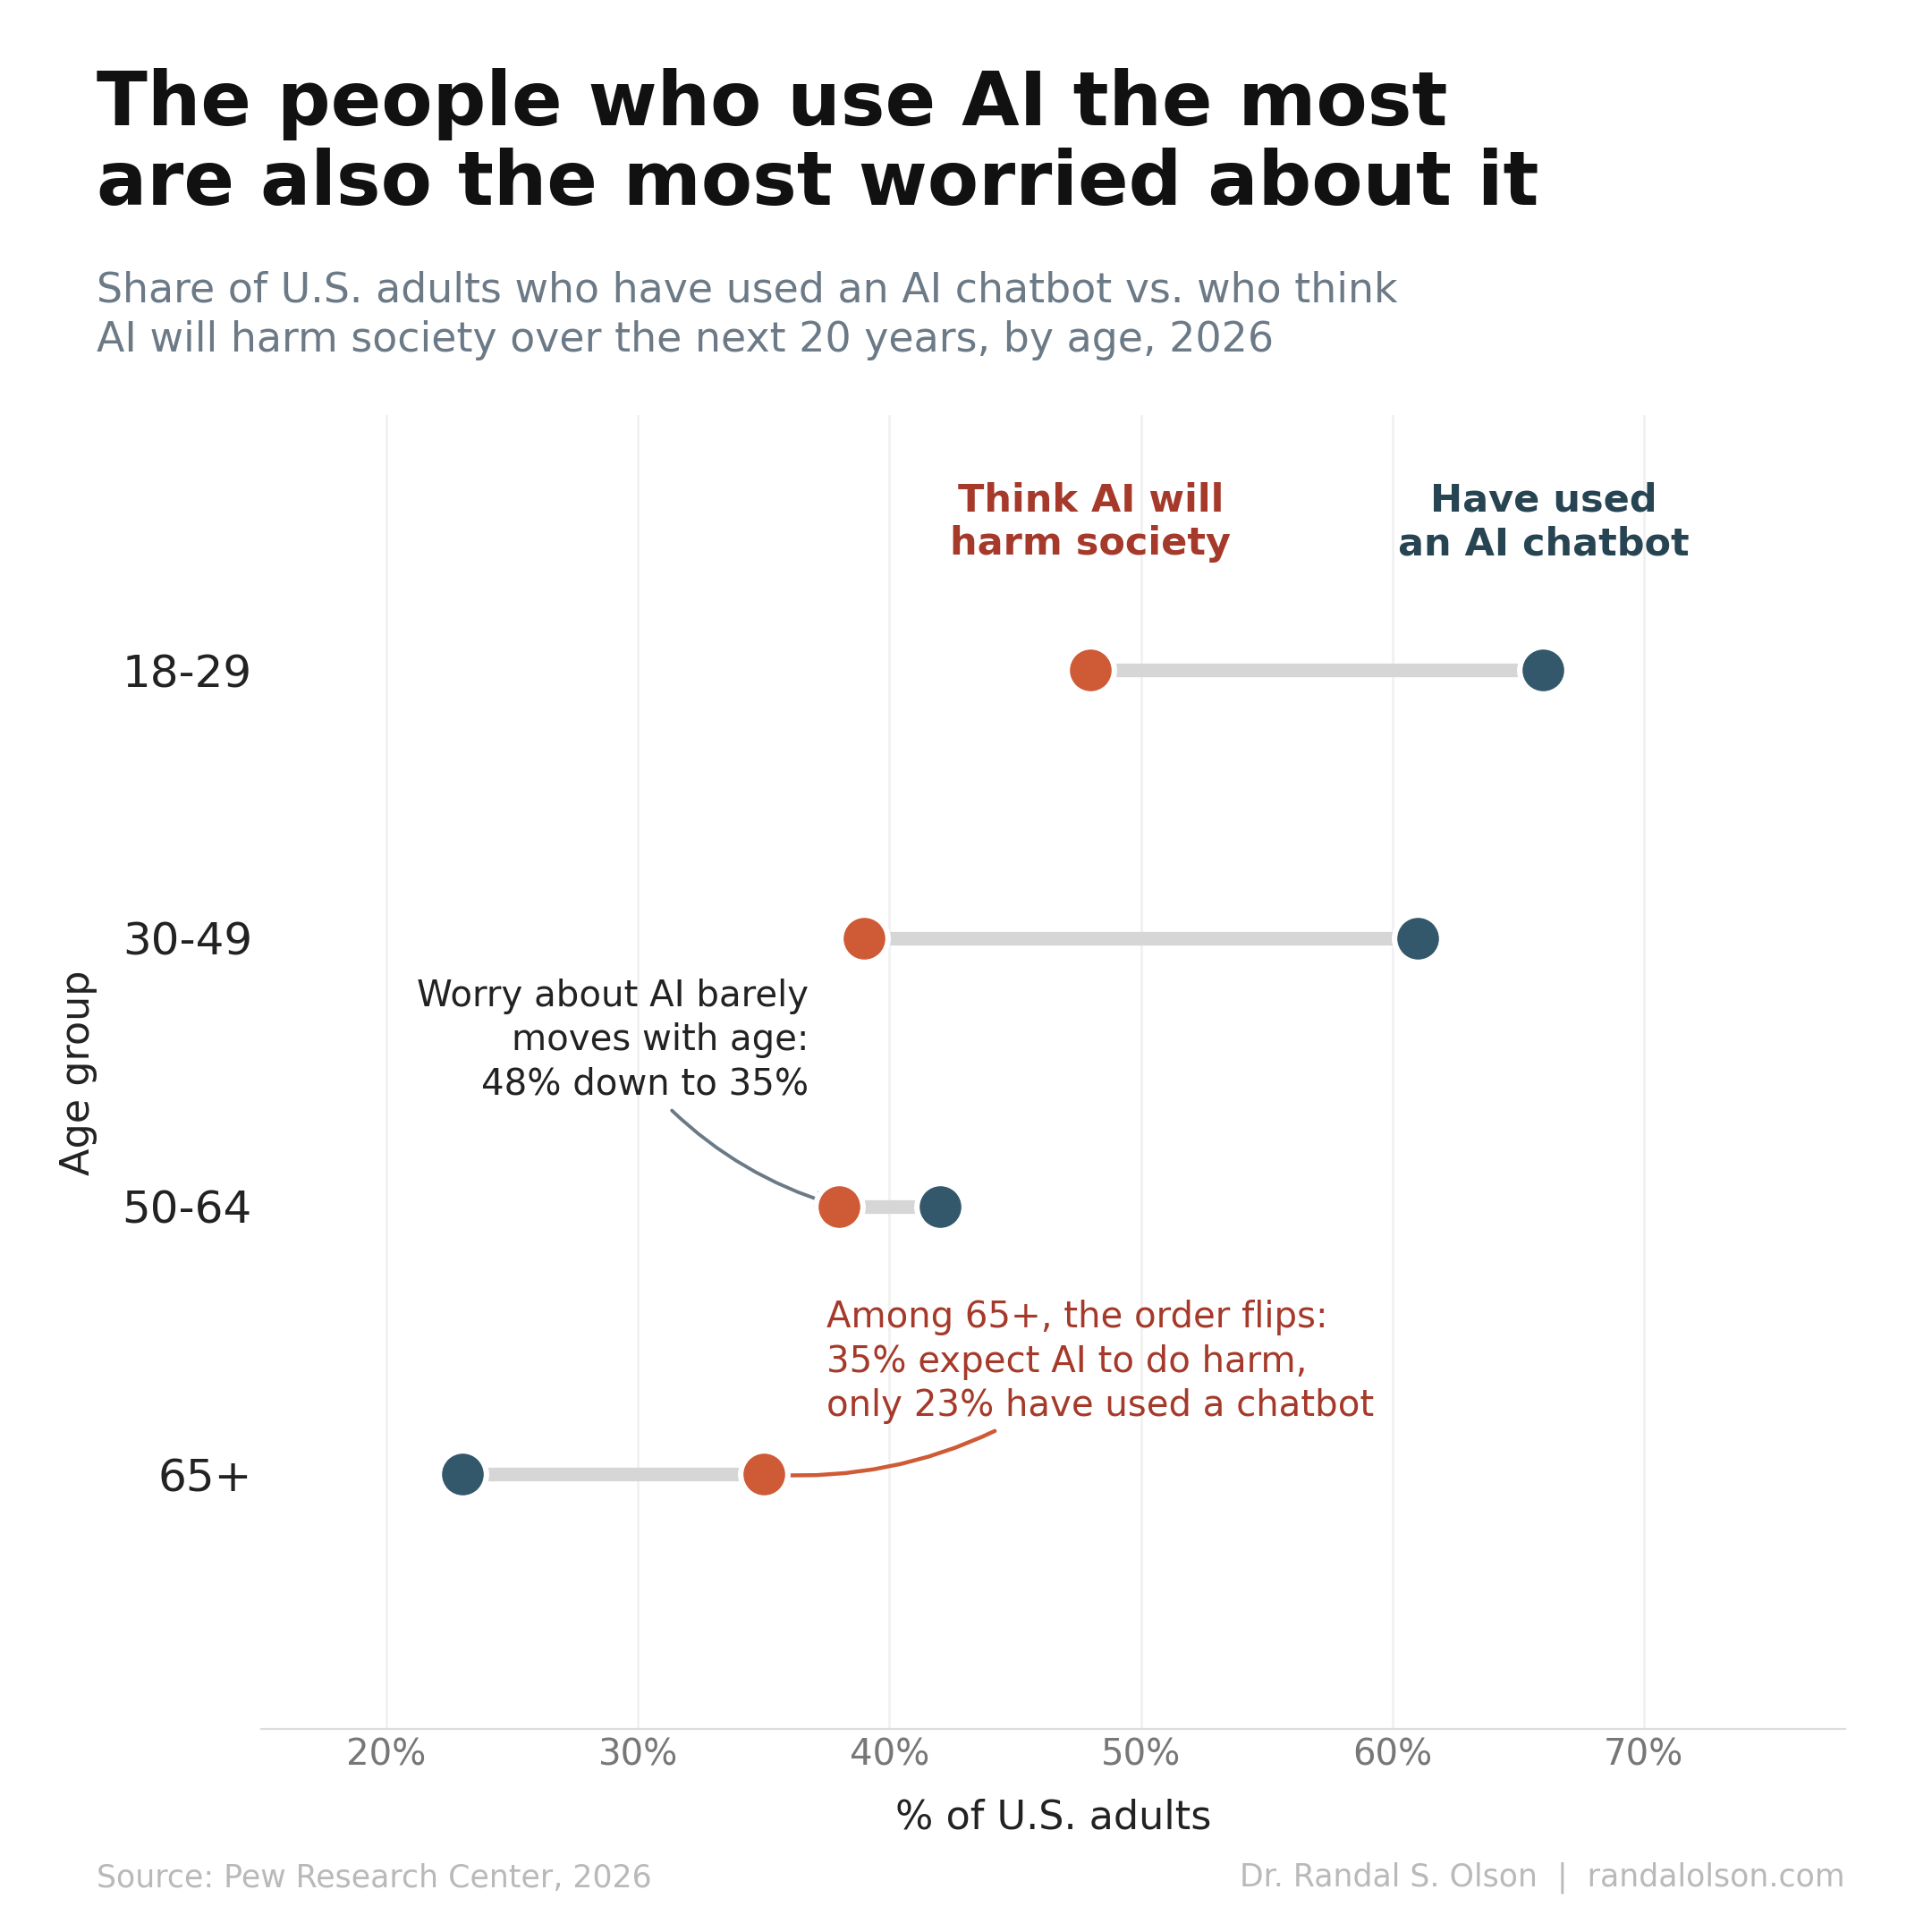
The median U.S. registered nurse is now 50 years old. The 2024 NCSBN National Nursing Workforce Survey, released in April 2025 and based on responses from 744,714 RNs, shows the age distribution has pulled apart at the ends. 1 in 5 RNs are now 65 or older, and the share of RNs under 30 fell to a 10-year low.
The chart below pairs the 2015 share of each 5-year age cohort with the 2024 share. The hollow dot marks 2015, the filled dot marks 2024. The middle bands barely moved. The two extremes did almost all the work.
1 in 5 RNs are now 65 or older
The 65+ share of the RN workforce grew from 12.4% in 2015 to 18.3% in 2024, a 5.9% jump and the single largest move in the distribution. The path was anything but straight. The 65+ share spiked to 19.0% in the 2020 survey as older nurses delayed retirement through the early pandemic, fell to 13.2% in 2022 as exhausted veterans left, then rebounded to 18.3% in 2024 as some returned.
NCSBN frames the recent rise as workforce stabilization rather than continued aging. The same survey warns that "many of the last of the baby boomers are expected to exit the workforce in 2027 as they reach retirement age." 39.9% of RNs say they intend to leave the workforce or retire within 5 years, and 41.5% of those name stress and burnout as the cause. Most of the 65+ cohort visible in the chart is one retirement decision away from exiting.
Why the under-30 share isn't bouncing back
At 7.9%, the under-30 share of the RN workforce hit its lowest level in the 10-year NCSBN series, below the prior low of 8.4% set in the 2020 survey. It would be easy to read this as a drop in interest from young people. Application data says otherwise.
The American Association of Colleges of Nursing reports that U.S. nursing schools turned away 80,162 qualified applications from baccalaureate and graduate programs in 2024. BSN enrollment grew 4.9% that same year, adding more than 12,000 new students. The bottleneck is faculty shortages, clinical placement sites, classroom space, and budget. About 1/3 of nursing faculty is expected to retire by 2025, which tightens the constraint right when the workforce most needs to expand it.
The 55-59 dip is the boomer wave moving through
The 55-59 row is the cleanest demographic mechanism in the chart. The 55-59 cohort fell 3.6 points, from 13.6% in 2015 to 10.0% in 2024. The same population that was 55-59 in 2015 is now 64-68, and the bulk of it has aged into the 65+ band. The size of the 55-59 drop is a near-mirror of the 65+ rise, which is what you would expect when a large cohort moves through a fixed distribution and few people enter behind it.
What happens after 2027
HRSA's 2024 Nurse Workforce Projections estimate an 8% shortage of registered nurses by 2028, narrowing to 3% by 2038 as the pipeline catches up. The national average hides the geography. By 2038, rural areas face an 11% RN shortage while metropolitan areas face 2%. More than 1 million nurses are projected to retire by 2030, which is most of the 65+ cohort shown at the bottom of the chart.
The pipeline is responding. Newly licensed RNs grew 36.1% from 2019 to 2023. Until nursing schools can seat the qualified applicants they currently turn away, the under-30 share is unlikely to recover and the 65+ share will keep doing the heavy lifting.
How this chart was made
An AI agent built this chart end-to-end as part of the Beautiful Charts with AI series. It pulled Table 6 of the NCSBN 2024 National Nursing Workforce Survey, computed the share for each 5-year age cohort in 2015 and 2024, rendered the pair as a dumbbell, and iterated on the design until it passed the Tufte Test, a data visualization quality standard from Goodeye Labs. The workflow behind it is public: run the same high-signal chart workflow to make your own.
Data source: Table 6 of "The 2024 National Nursing Workforce Survey", Journal of Nursing Regulation, April 2025 supplement, from the National Council of State Boards of Nursing. HRSA projection figures come from the 2023-2038 Nurse Workforce Projections fact sheet and the 2024 State of the Health Workforce Report, both from the U.S. Bureau of Health Workforce. Nursing school capacity figures come from the American Association of Colleges of Nursing Nursing Faculty Shortage fact sheet. The CSV used for this chart is available here.
Beautiful Charts with AI
Make your own charts with the same workflow
Every chart in this series is built by the same public workflow. Fork it and run it yourself, then grade the result against the Tufte Test.

Dr. Randal S. Olson
AI Researcher & Builder · Co-Founder & CTO at Goodeye Labs
I’ve worked in AI for 15+ years. At Goodeye Labs, we build AI products that point frontier models at the business outcomes a team actually cares about.