U.S. federal workforce hits 60-year low after fastest peacetime cut
Part of Teaching an AI Agent to Make Beautiful Charts
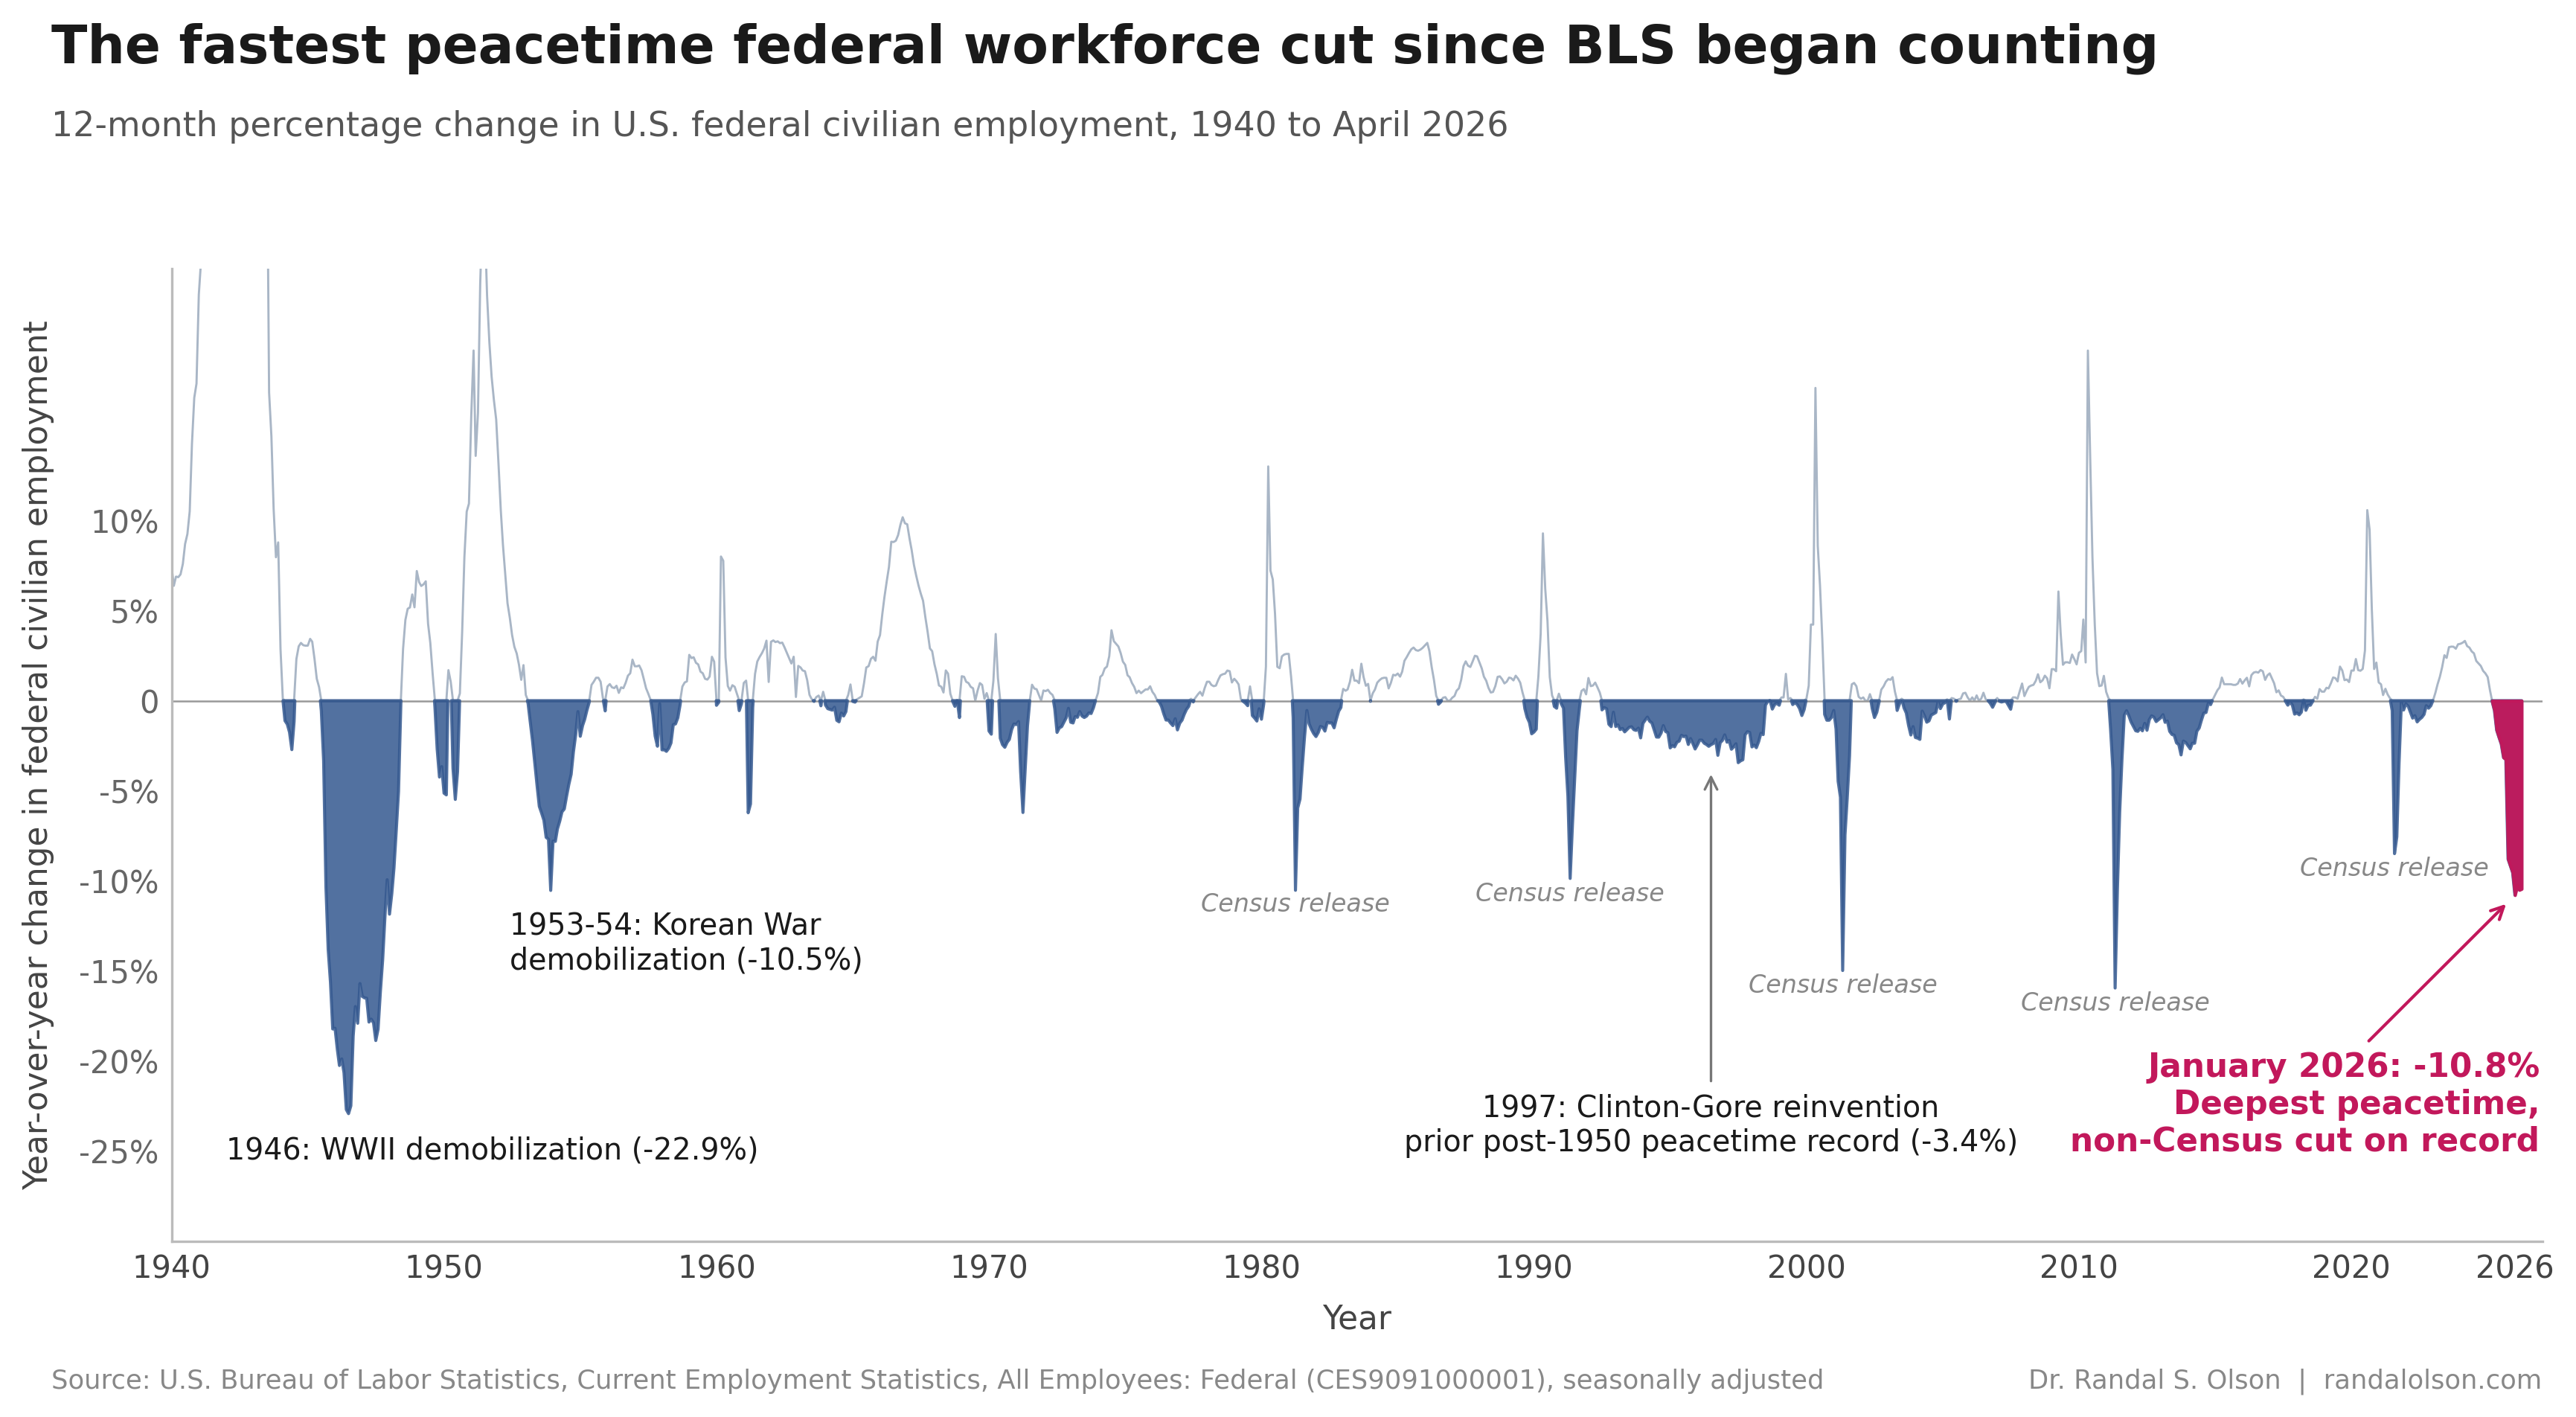
Federal civilian employment has only fallen this fast a handful of times since the Bureau of Labor Statistics started counting in 1939. Every prior episode has a tidy explanation. WWII demobilization in 1946. Korean War demobilization in 1953-54. The pulse of temporary Census workers coming off the rolls after each decennial Census. The contraction running through April 2026 is the first that doesn't fit any of those buckets.
The April number, released by BLS on May 8, put the federal civilian payroll at 2,665,000 workers. That is 348,000 below the October 2024 peak and the smallest the federal civil service has been since May 1966. The cut is also the deepest peacetime, non-Census 12-month drop in the entire BLS series. Year over year, the federal workforce shrank 10.5%. The previous post-1950 record holder, the Clinton-Gore reinvention of the late 1990s, peaked at 3.4%.
The 1980s and 1990s mirage
The chart looks like there are 2 clear precedents for the current cut. Around 1981 the line plunges almost as deep. So does 1991. If you've ever read a sentence like "the federal workforce shrank in the early 1980s" or "after the Cold War", these are the troughs the writer was looking at.
Neither of them is what most readers think it is. Both are dominated by the wind-down of temporary Census workers that the federal government had hired in the spring of 1980 and the spring of 1990. April 1980 alone added roughly 300,000 temporary workers to the federal headcount; when those workers came off the rolls a year later, the year-over-year change went deeply negative whether or not the standing civil service had moved at all. The Reagan-era reductions in force were real, but the standing-workforce drop from his January 1981 inauguration to the 1981-82 recession trough in May 1982 was 106,000 workers, or 3.6%. The PATCO firings of August 1981 accounted for about 11,000 of that. The rest was attrition and a hiring freeze.
Strip out the Census, and the deepest peacetime year-over-year drop on record before 2025 was 3.4%. The current trough at 10.8% is just over 3x that.
What 18 months looks like next to 6 years
Federal employment is sticky. Civil servants have job protections, agencies have appropriations cycles, and most administrations move the standing workforce by a few percent over a presidential term. The standard comparison for a deliberate peacetime cut is the Clinton-Gore reinvention. Vice President Gore launched the National Performance Review in March 1993 with a target of 252,000 federal positions cut over 5 years. By January 1999 the federal civil service had shrunk by 327,000 workers, a reduction of 10.6% over 6 years.
The current contraction has cut 348,000 workers in 18 months. Same magnitude, a quarter of the time. A deferred-resignation offer that ran for 2 weeks pulled about 154,000 people off the standing federal payroll in a single batch.
The Fork in the Road
On January 28, 2025, the new administration sent a memo to most of the federal civil service titled "Fork in the Road." It offered a deferred resignation: leave by September 30 and continue drawing full pay and benefits in the meantime. Acceptance had to be filed within 2 weeks, by 7:20 PM Eastern on February 12. About 154,000 employees took the deal and stayed on administrative leave for 6 months or longer; administration projections put the total higher than 200,000 once later waves were counted.
That memo did most of the work. The rest came from formal Reductions in Force, which hit hardest at agencies the administration had been most public about wanting to shrink. The Department of Health and Human Services announced 20,000 cuts in March 2025, about a quarter of the department. Smaller RIFs hit the Department of Education, the Consumer Financial Protection Bureau, USAID, and others, sometimes followed by court orders that paused or reversed them. A government-wide hiring freeze let attrition do the rest of the work without making news.
The cuts now look to be slowing. The April 2026 monthly drop was 9,000 workers, against monthly drops of 25,000 to 50,000 through the spring and summer of 2025. The 12-month rolling change has eased from 10.8% in January to 10.5% in April. Some agencies are quietly rehiring people they cut, after discovering they could not perform basic functions without them. The fastest peacetime cut on record may be approaching its floor.
Why the Census shows up so often in this chart
One detail in the chart is worth a closer look: the deepest non-WWII drops in the entire 87-year series are both Census artifacts. The 2010 Census peaked at 564,000 temporary workers in May 2010, the 2020 Census peaked at 288,000 in August 2020 (smaller because of online self-response and pandemic compression), and every prior cycle had a comparable spike. Per BLS analysis, those temporary workers come on the federal payroll in the spring of years ending in zero and come off it a year later. The rolling year-over-year change picks up the difference and registers it as a contraction even though the standing civil service has been steady the entire time.
This matters for any historical comparison of federal workforce trends. The 1981 and 1991 troughs in the chart are mostly the 1980 and 1990 Census wind-downs, not policy choices. The current contraction has no Census interaction at all. Its 12-month window from April 2025 to April 2026 contains zero temporary-Census-worker hiring or release activity. The standing civil service did all the moving.
How this chart was made
An AI agent built this chart end-to-end as part of the Beautiful Charts with AI series. It pulled the BLS Current Employment Statistics series for federal civilian employment from FRED, computed the year-over-year percentage change for every month from 1939 through April 2026, classified each trough by historical episode, and iterated on the design until it passed the Tufte Test, a data visualization quality standard from Goodeye Labs. The workflow behind it is public: run the same high-signal chart workflow to make your own.
Data sources: FRED series CES9091000001 from the U.S. Bureau of Labor Statistics Current Employment Statistics, "All Employees: Federal", seasonally adjusted, monthly, January 1939 through April 2026. The April 2026 figure comes from the May 8, 2026 Employment Situation release. The CSV used for this chart is available here.
Beautiful Charts with AI
Make your own charts with the same workflow
Every chart in this series is built by the same public workflow. Fork it and run it yourself, then grade the result against the Tufte Test.

Dr. Randal S. Olson
AI Researcher & Builder · Co-Founder & CTO at Goodeye Labs
I’ve worked in AI for 15+ years. At Goodeye Labs, we build AI products that point frontier models at the business outcomes a team actually cares about.