World Happiness Report 2026: what income can't explain
Part of Teaching an AI Agent to Make Beautiful Charts
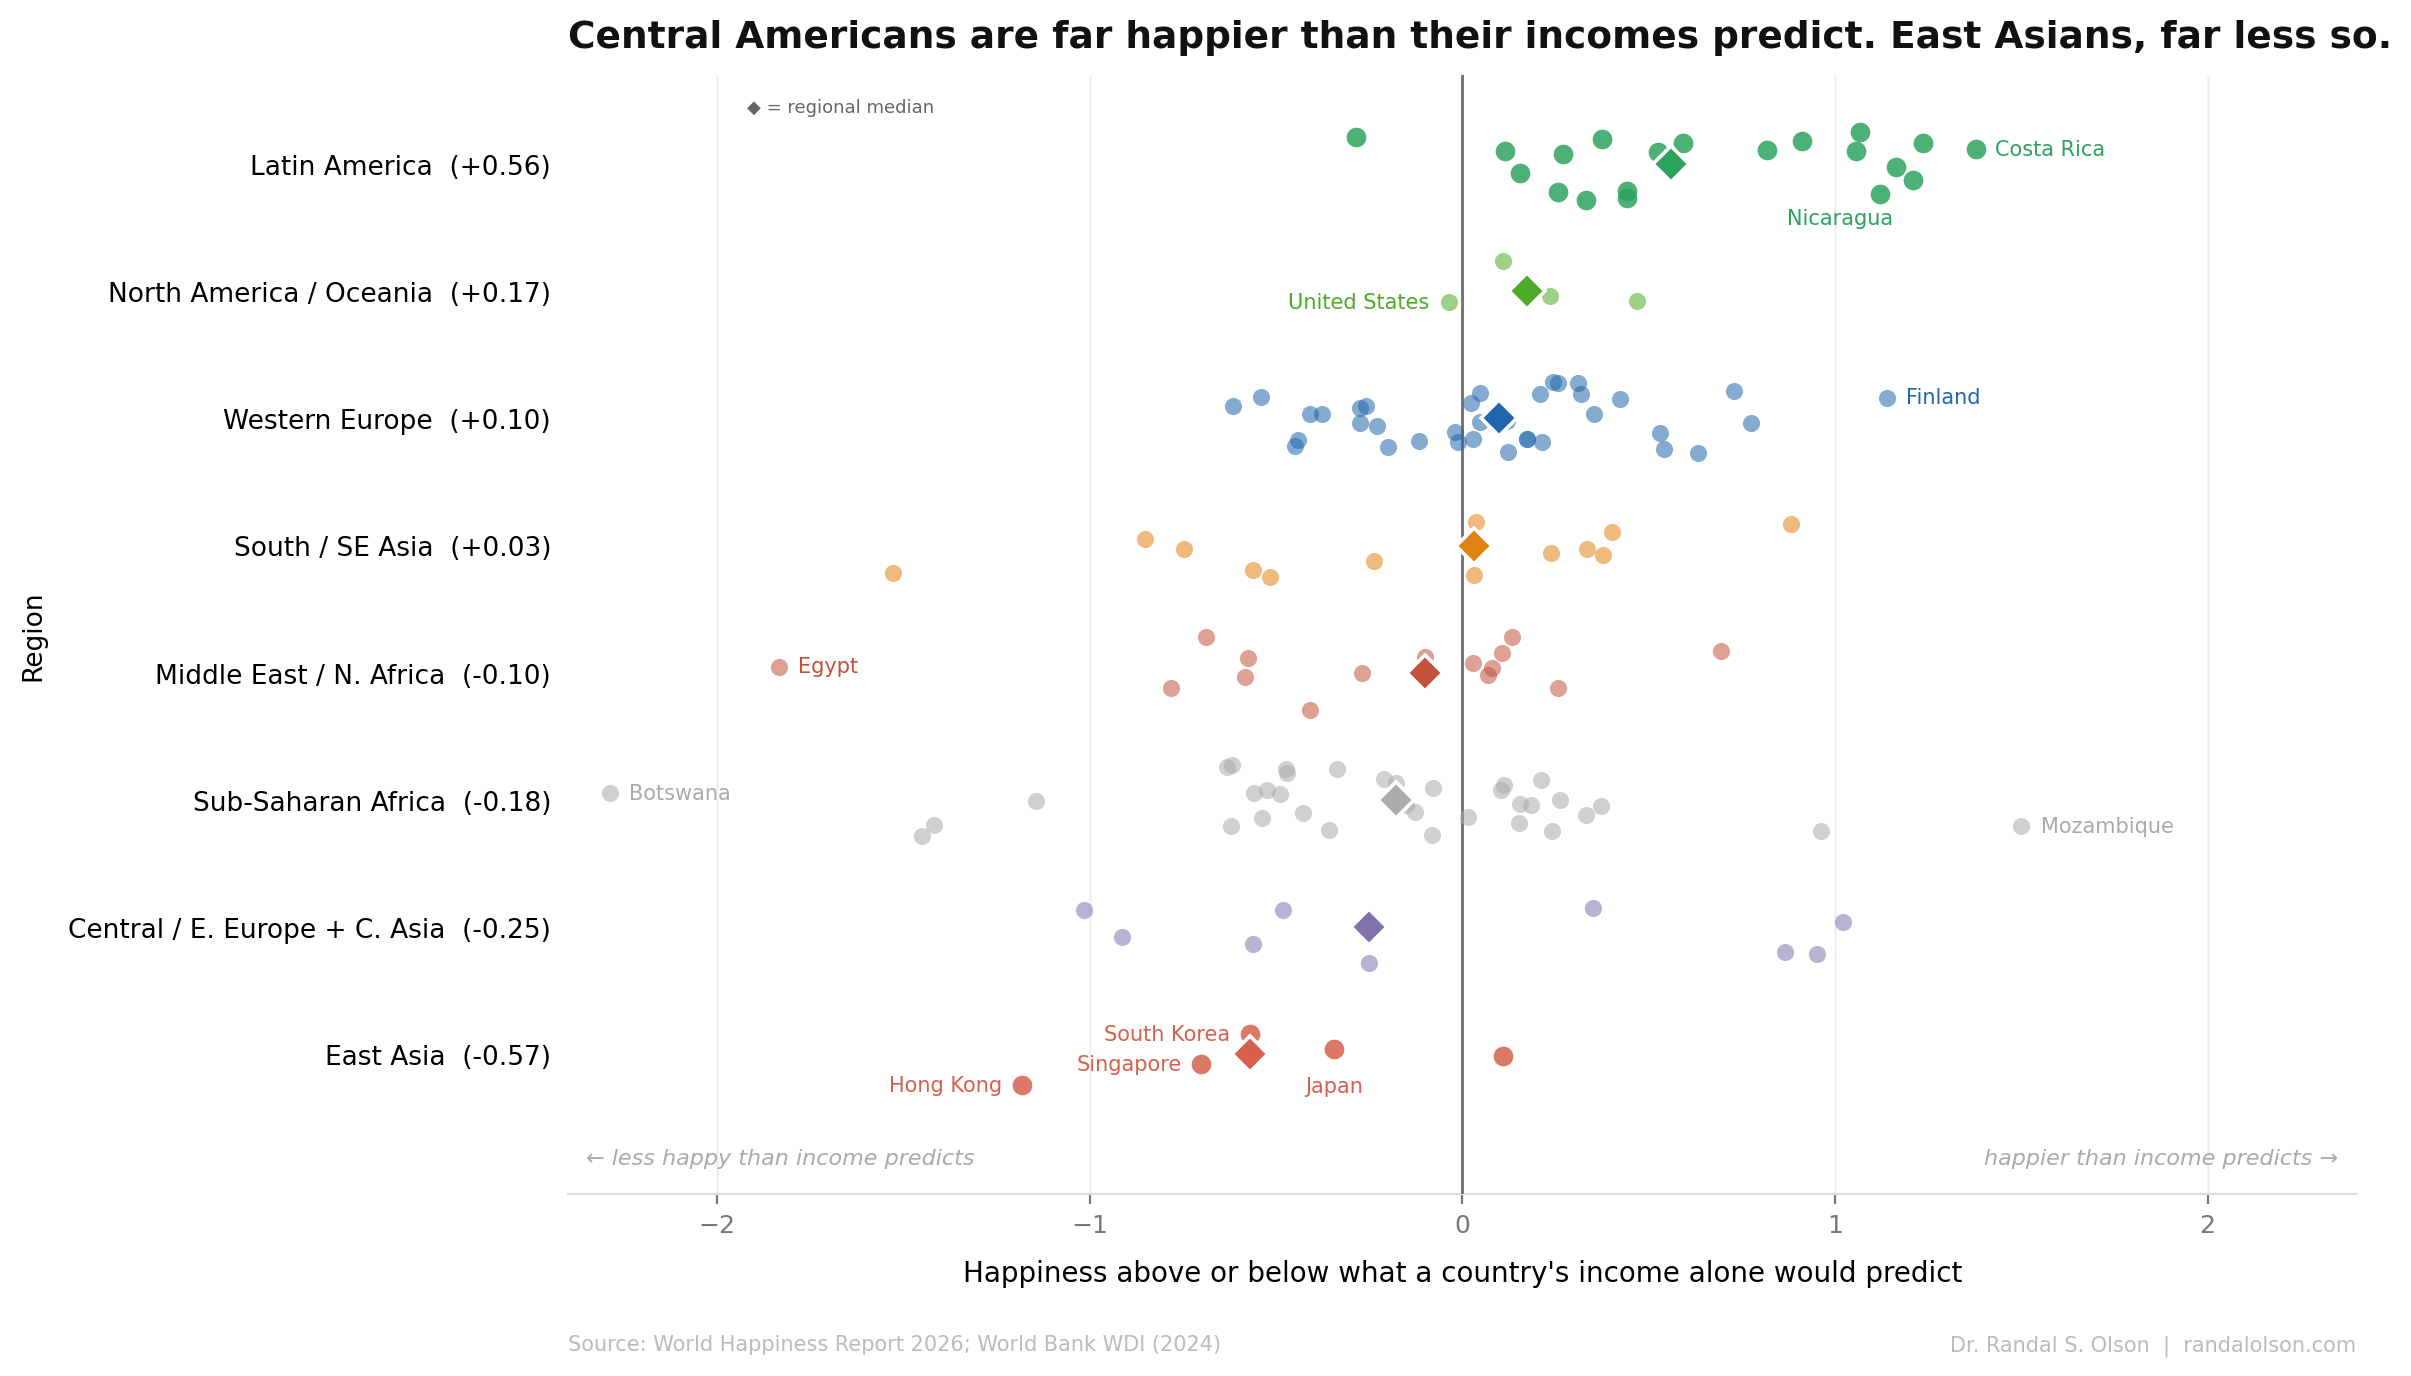
Costa Rica ranked #4 in the 2026 World Happiness Report, its highest finish ever. Its GDP per capita is about $27,000 in purchasing-power terms, less than a quarter of what Singapore earns and about a third of the U.S. figure. Yet Costa Rica sits above Sweden, above Australia, above Germany. Strip out what income explains, and the real story is even stranger.
Latin America's 19-for-20
Run a regression of happiness on income across all 138 countries with data and you get a fairly predictable line: richer countries are happier. Every Central American country in the dataset sits well above that line. So does nearly every other country in Latin America. Of the 20 Latin American countries with World Bank income data, 19 score higher than income alone would predict. Trinidad and Tobago is the lone exception, barely below the prediction at -0.29 points.
This pattern has held for over a decade. Mariano Rojas, writing in the 2018 World Happiness Report, found that Latin American life evaluations run above what the standard six-variable model predicts, a gap later quantified at roughly 0.6 points. His analysis identifies the quality and abundance of family ties as the main driver. In Latin America, family functions as the primary social safety net rather than state institutions, and the data shows it counts for a lot in self-reported happiness.
That shows up at the extreme end too. Nicaragua has a GDP per capita of about $7,700, low enough that a strict income-to-happiness model would predict a score around 5.1. Its actual score is 6.3. A study of 99 garbage collectors in Leon, Nicaragua found zero correlation between monthly income (ranging from under $25 to over $65) and happiness, while satisfaction with family and friends was by far the strongest predictor of wellbeing. The Gallup Global Emotions Report found that in 2024, Latin American countries dominated the top of the Positive Experience Index, with Paraguay and Panama leading at 86 out of 100 against a world average of 71.
The East Asian shortfall
The other end of the chart is just as striking. Japan, South Korea, Singapore, and Hong Kong all score well below what income predicts. Singapore has a GDP per capita of roughly $133,000, the highest in the dataset, yet its happiness score (6.59) sits about 0.70 points below the regression line. Hong Kong earns around $66,000 per capita but scores 1.18 points below prediction. Four of the five East Asian economies with income data fall below zero. China is the exception, coming in marginally above the line at +0.11 points.
This pattern has a name. Yew-Kwang Ng identified it in 2002 as the "East Asian happiness gap", arguing that Confucian-influenced achievement orientation makes people drive for the next goal rather than enjoy the current one. A more recent review by Choi and Choi (2025) identifies five cultural mechanisms behind the gap. Among them: East Asians are more likely to evaluate their lives against external standards rather than internal feelings, and more sensitive to social comparison. Choi and Choi argue these are real wellbeing differences, not artifacts of self-reporting.
Hong Kong adds structural factors on top of that cultural baseline. Its Gini coefficient is 0.539, among the highest of any developed economy. Housing prices run more than 14 times median household income, against a threshold of 3.0 for what demographers consider affordable. The political unrest of 2019 pushed depression prevalence from roughly 2% to 11% in a matter of months.
What the gap tells us about money
The regression line captures a real relationship. Richer countries do tend to be happier, and the correlation holds across the full 138-country dataset. But the residuals show how much variance income leaves unexplained. Costa Rica, earning about $27,000 per person, scores as high as the model predicts for a country earning $160,000. Nicaragua at $7,700 scores 1.2 points above what income would predict, one of the largest positive residuals in the dataset. Income predicts the floor, not the ceiling.
The Latin American surplus and the East Asian shortfall have held across multiple WHR editions. GDP growth can shift a country's predicted happiness score, but it does not change which side of the regression line a country falls on. That part comes from somewhere else.
How this chart was made
An AI agent built this chart end-to-end as part of the Beautiful Charts with AI series. It pulled happiness scores from the World Happiness Report 2026, fetched GDP per capita PPP data from the World Bank API, ran an OLS regression of happiness on log(GDP), and computed residuals for 138 countries. The chart design iterated until it passed the Tufte Test, a data visualization quality standard from Goodeye Labs. The workflow behind it is public: run the same high-signal chart workflow to make your own.
Note on coverage: Venezuela is excluded because the World Bank does not publish a current GDP figure for it. Taiwan is also excluded for the same reason. Afghanistan has a happiness score in the WHR (1.45) but no matching World Bank GDP entry and is excluded from the residuals analysis.
Data sources: World Happiness Report 2026 (Cantril ladder scores, 3-year average 2023-2025); World Bank WDI indicator NY.GDP.PCAP.PP.KD (GDP per capita PPP, constant 2021 international dollars, 2024). The full dataset used for this chart is available here.
Beautiful Charts with AI
Make your own charts with the same workflow
Every chart in this series is built by the same public workflow. Fork it and run it yourself, then grade the result against the Tufte Test.

Dr. Randal S. Olson
AI Researcher & Builder · Co-Founder & CTO at Goodeye Labs
I’ve worked in AI for 15+ years. At Goodeye Labs, we build AI products that point frontier models at the business outcomes a team actually cares about.