The 2026 Indy 500 was the closest finish in race history
Part of Teaching an AI Agent to Make Beautiful Charts
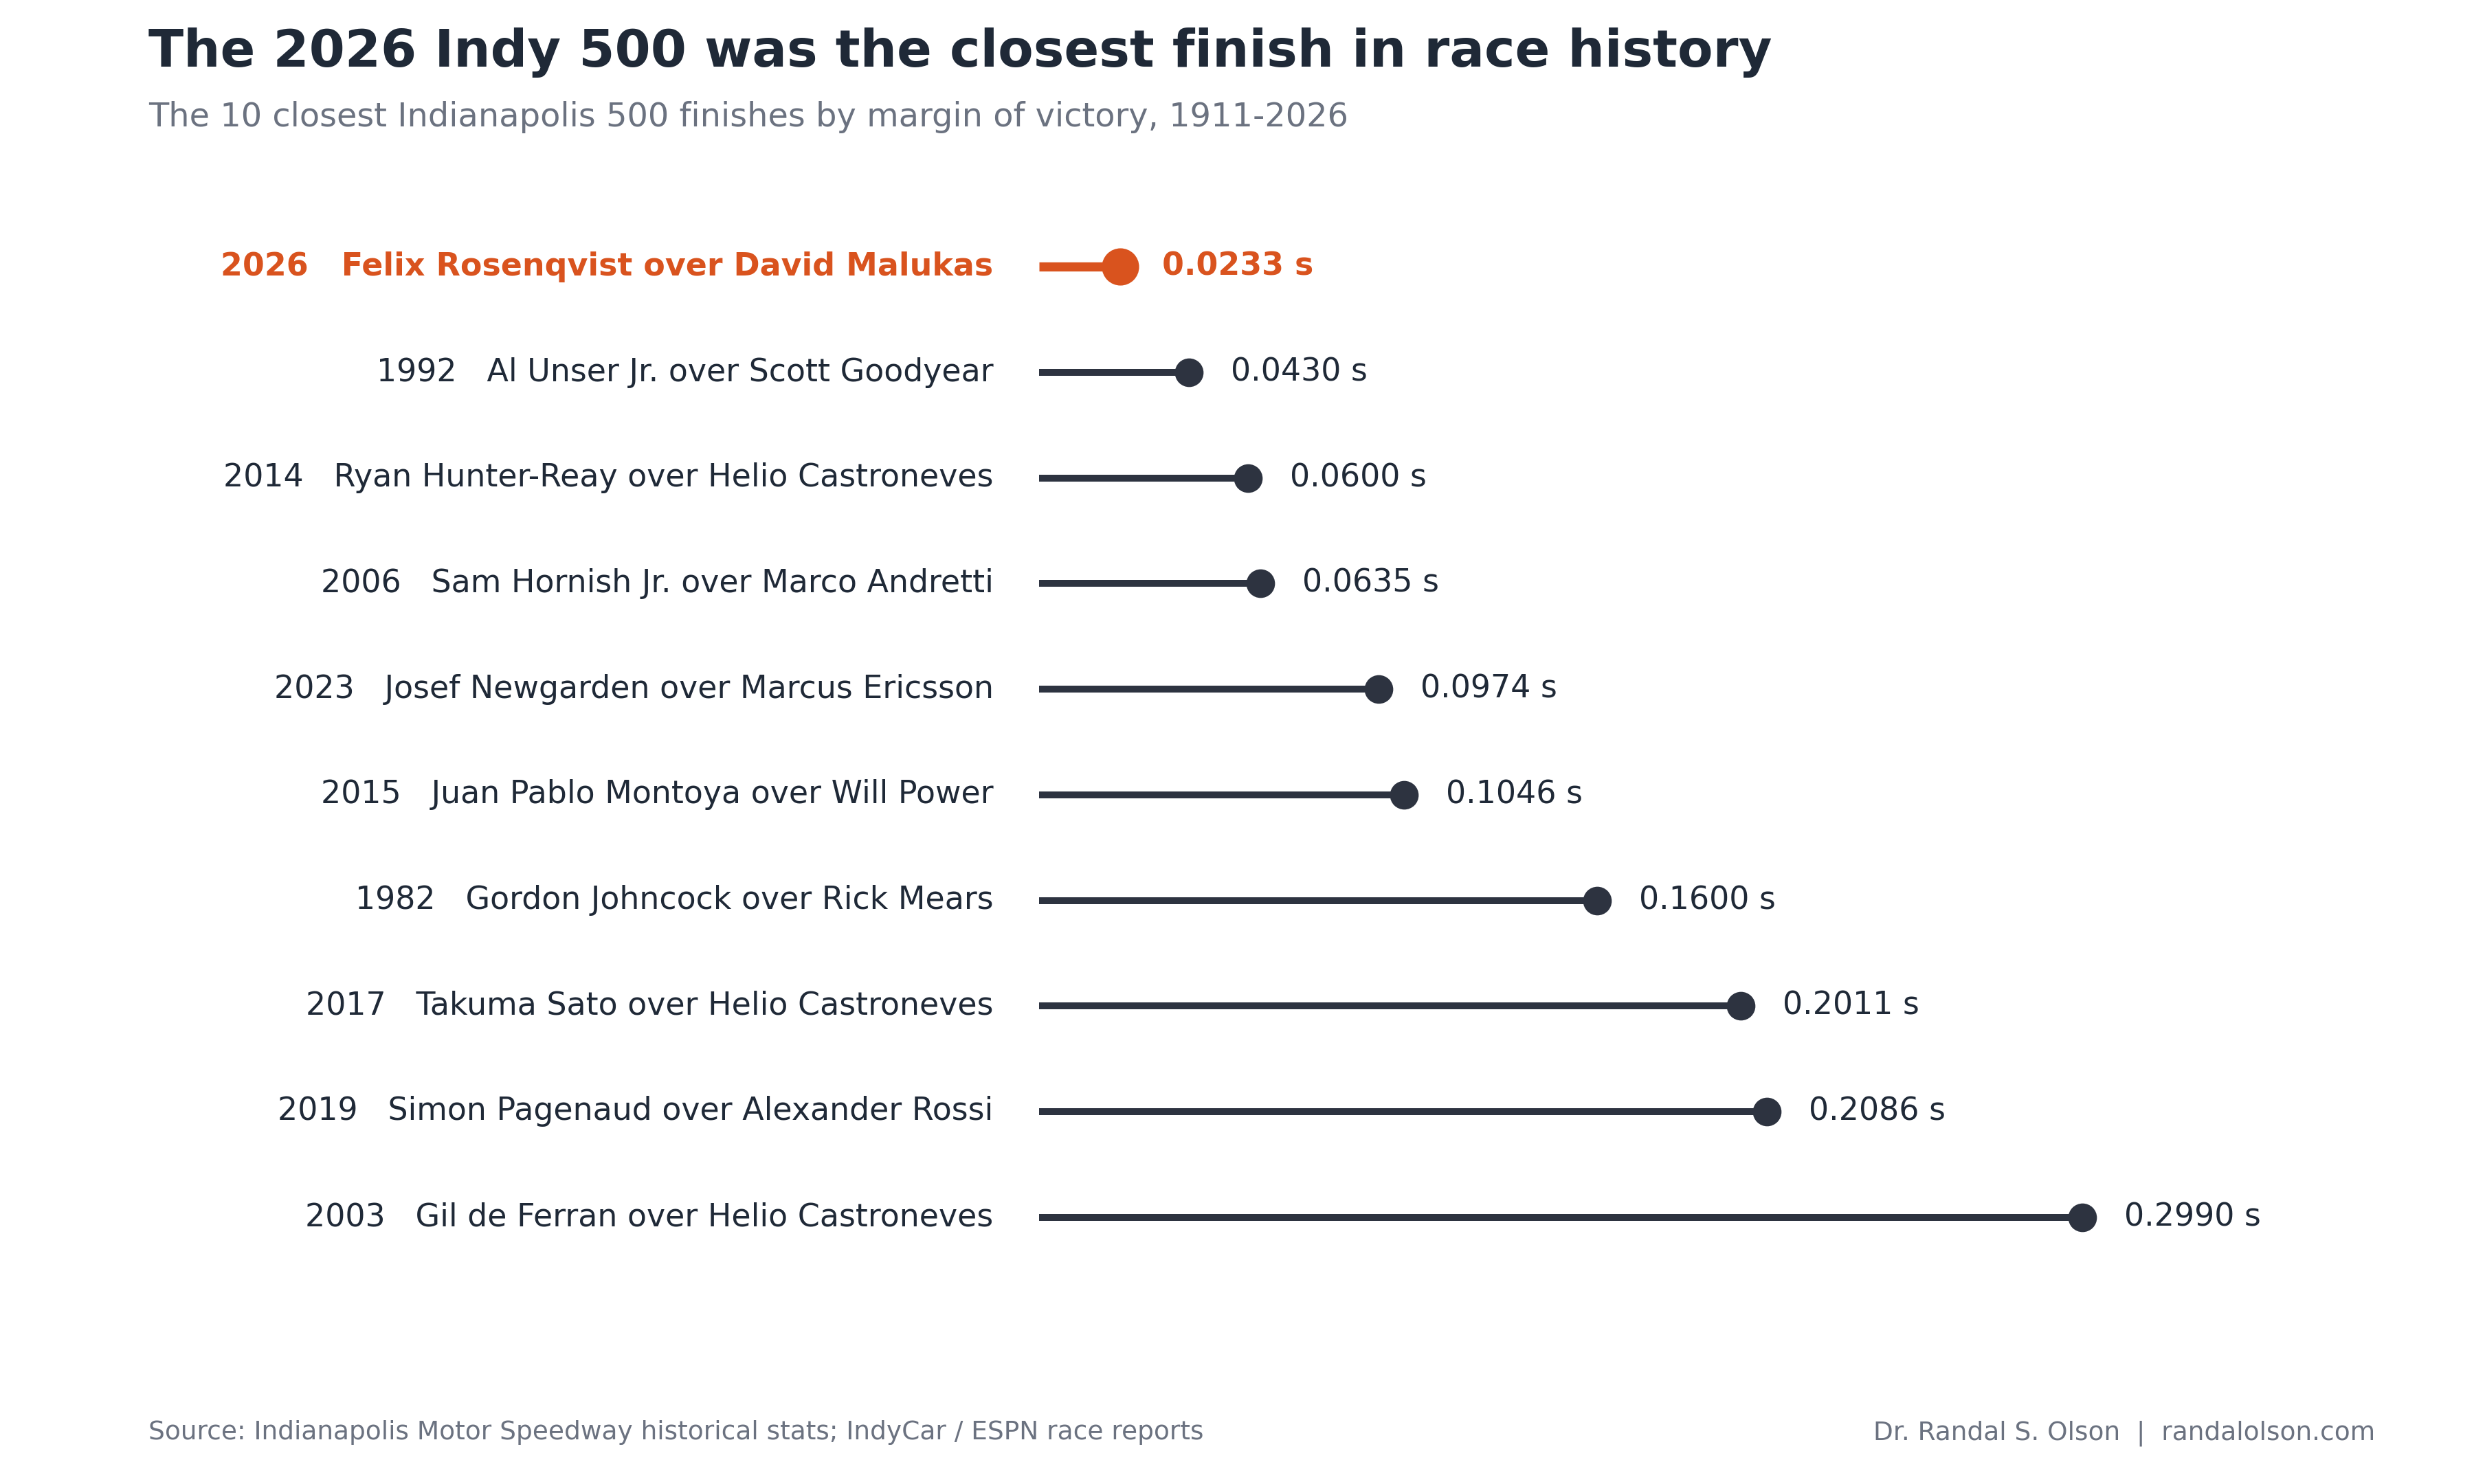
On Sunday, May 24, 2026, Felix Rosenqvist beat David Malukas to the finish line at the 110th Indianapolis 500 by 0.0233 seconds, the closest margin in the race's history. The record it broke had stood since 1992.
A 7-lap shootout decided it
Two late cautions reshaped the race. Rookie Caio Collet's fiery crash with 8 laps to go brought a red flag, and a second caution on lap 197 after Mick Schumacher hit the SAFER barrier set up a one-lap shootout. Rosenqvist's Meyer Shank Racing teammate Marcus Armstrong took the white flag in the lead, with Malukas second and Rosenqvist third. Malukas powered into the Turn 1 lead on the final lap. Rosenqvist passed Armstrong on the high line out of Turn 4, then caught Malukas exiting the corner and won the drag race down the front stretch. The margin at the line was 0.0233 seconds, or roughly half an Indy-car length at 220 miles per hour.
"It kind of worked out the right way when I got back to third, and then I just had to run a flat-out lap on the high line, and it stuck," Rosenqvist said afterward. It was his first Indy 500 win, and Meyer Shank Racing's first IndyCar victory since 2021.
The 34-year-old record it finally beat
The previous closest finish came from a brutally cold race day. On May 24, 1992, with a high of 58 degrees, Al Unser Jr. held off Scott Goodyear by 0.043 seconds on cold, slick tires that turned the day into a crash-filled marathon. Michael Andretti had led by nearly 30 seconds before a fuel pump failure ended his race 11 laps from the finish. Unser Jr. became the first second-generation Indy 500 winner, and the side-by-side finish-line photo became one of the iconic images of IndyCar racing.
That margin held the record for 34 years. Rosenqvist's 2026 finish was 1.85 times closer.
Every one of the 10 closest finishes has come since 1982
The top 10 list has no race from the first 7 decades of the Indy 500 on it. The oldest entry is 1982, when Gordon Johncock held off Rick Mears by 0.16 seconds. 6 of the top 10 have come since 2014. The modern Indy 500 produces sub-half-second finishes at a faster pace than any prior generation of the race.
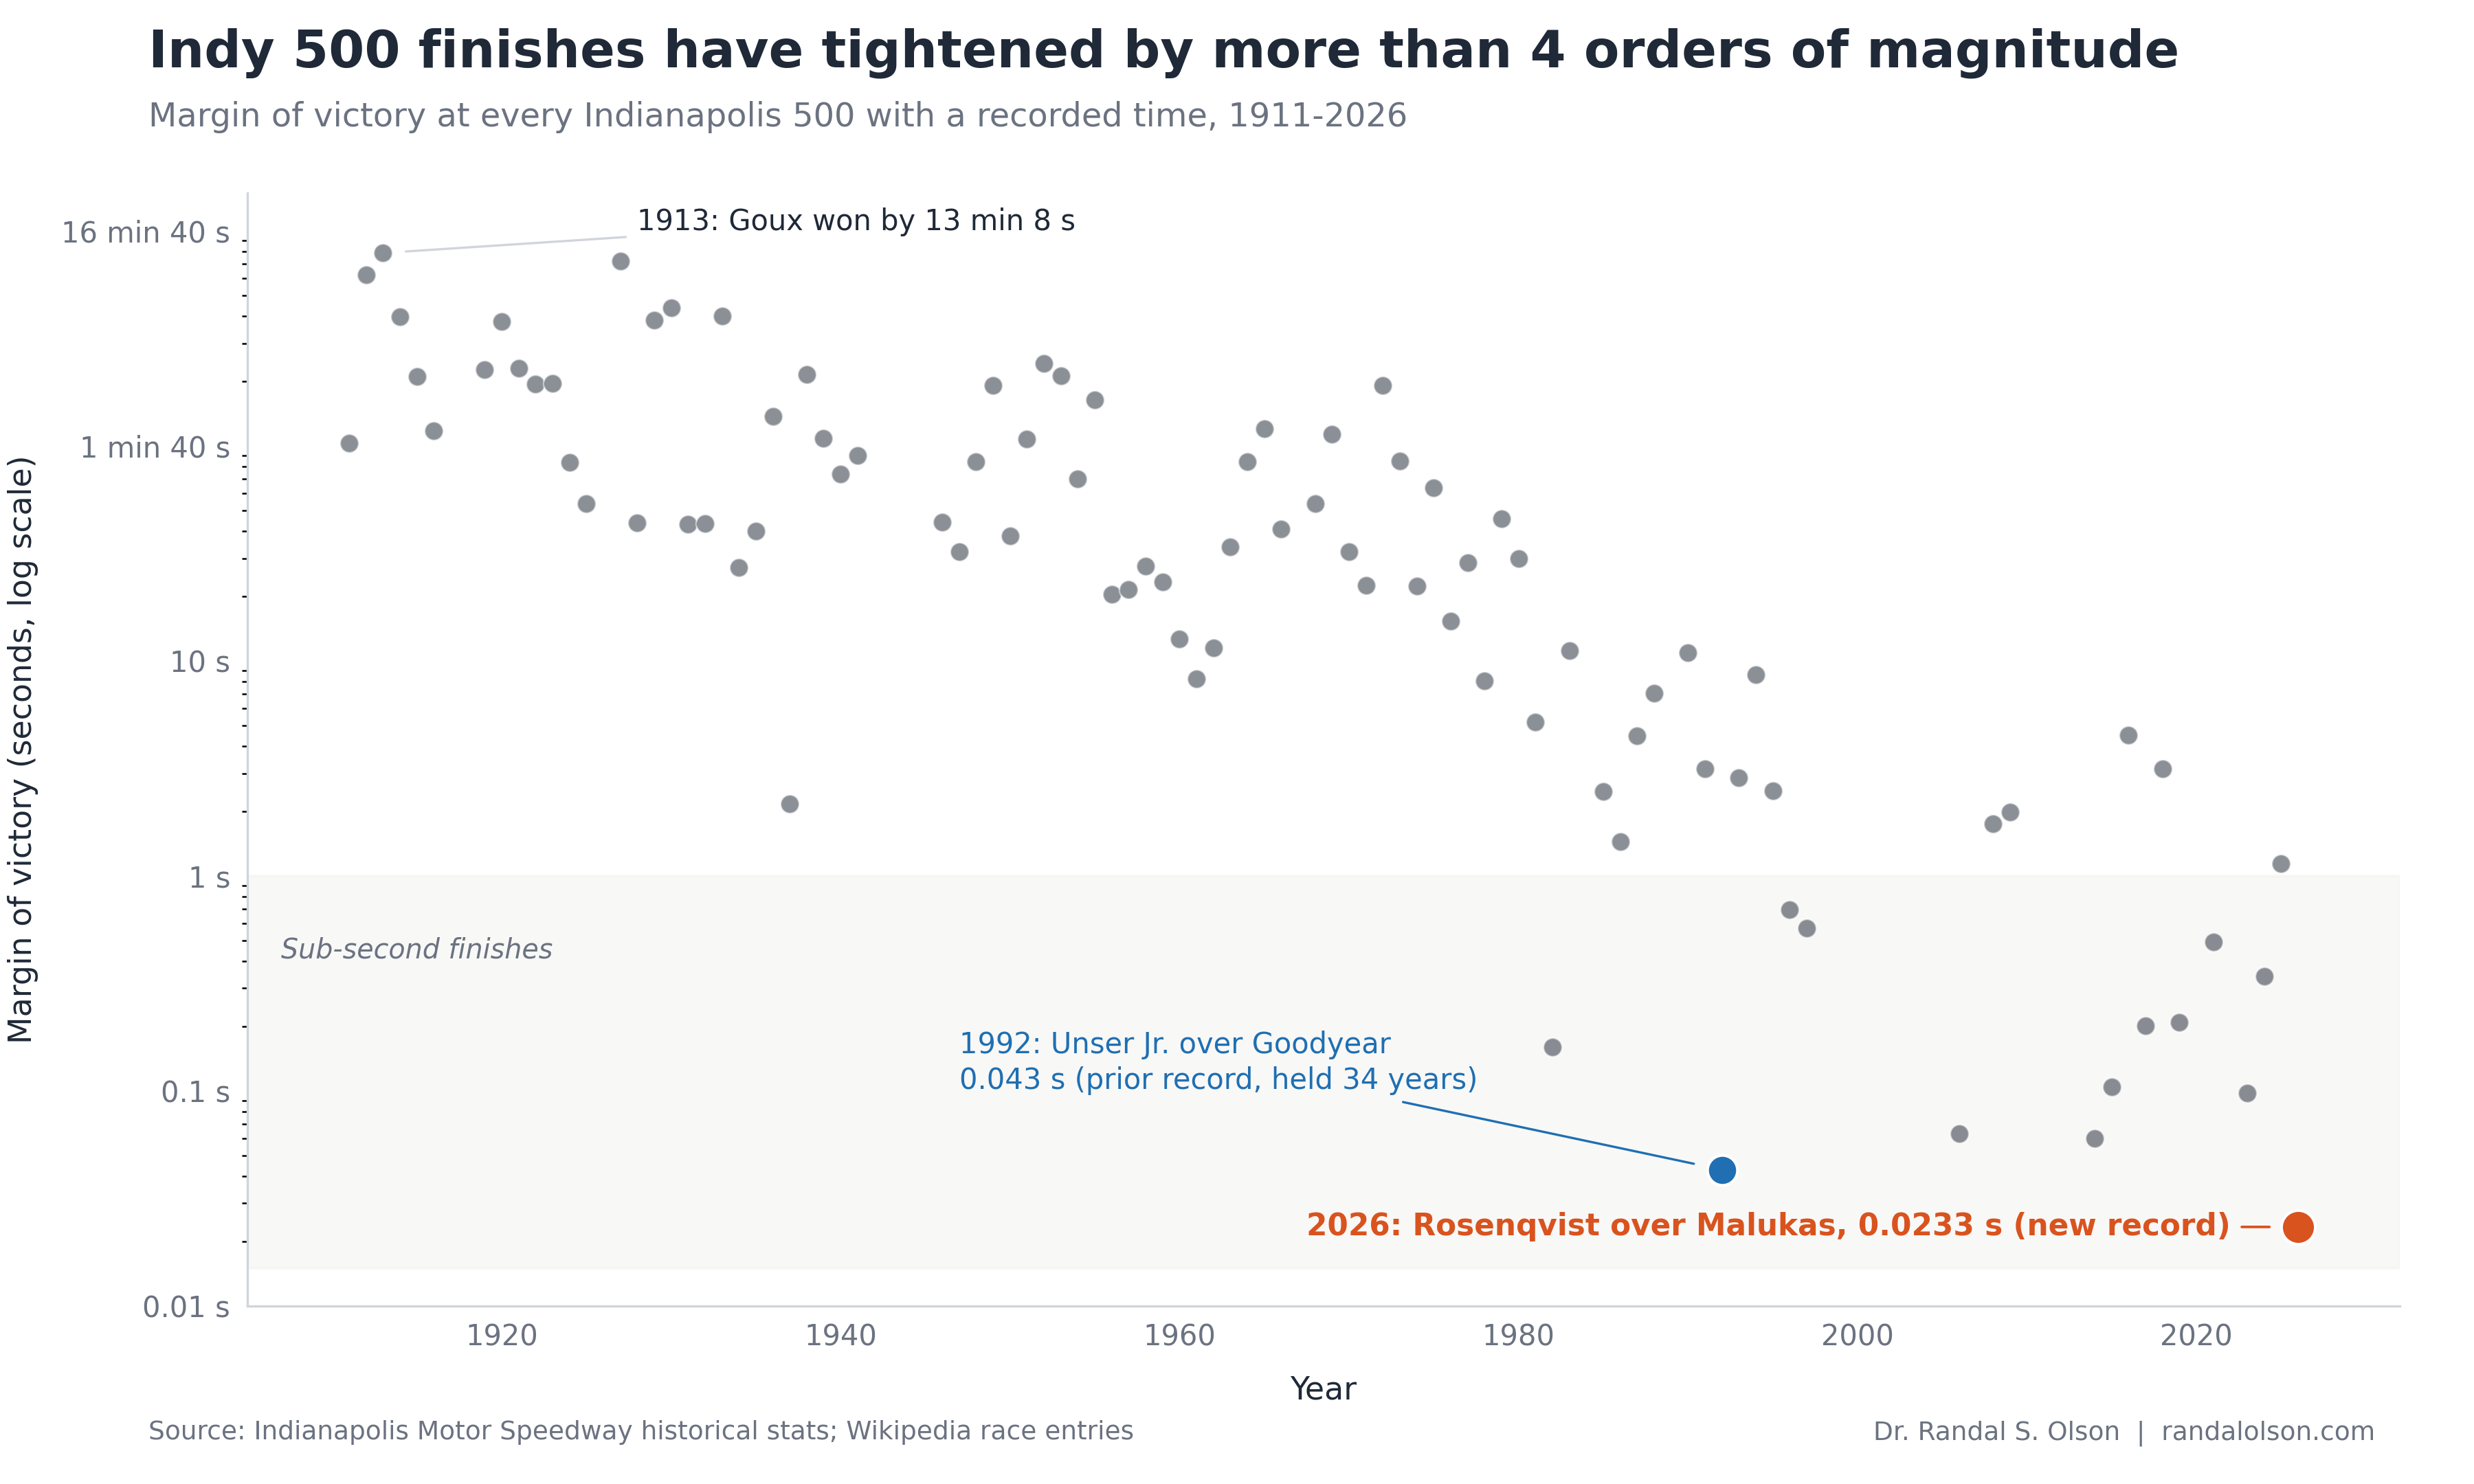
From 13-minute margins to thousandths of a second
In 1913, French driver Jules Goux won the 3rd-ever Indianapolis 500 by 13 minutes and 8 seconds, drinking champagne at his pit stops to stay hydrated through the 6-hour-plus race. Through the 1920s and 1930s, margins were typically measured in minutes. Cars broke. Drivers had to slow for the simple act of finishing.
By the 1960s, durability had improved and the typical margin had fallen to under a minute. By the early 1980s, sub-10-second finishes were common. Electronic transponder timing arrived at Indianapolis in 1990 and made decimal-place margins meaningful for the first time. What's done the rest is parity: common chassis, regulated aero, fuel-and-tire strategies that converge late in a race, and a depth of competition at the top of IndyCar that makes one-lap shootouts a recurring feature rather than a freak event.
The chart spans more than 4 orders of magnitude: the 1913 margin of 788 seconds is roughly 34,000 times the 2026 margin of 0.0233 seconds. Track time, telemetry, and a more competitive field have collapsed the distance between winners and runners-up to the resolution of the timing system itself.
How this chart was made
An AI agent built these charts end-to-end as part of the Beautiful Charts with AI series. It compiled the Indianapolis Motor Speedway's official margin-of-victory data, added the 2026 result from IndyCar's race report, and iterated on the design until both charts passed its own chart-quality review.
Data source: Indianapolis Motor Speedway's historical margin-of-victory page for every race with a recorded time, with the 2026 figure confirmed by IndyCar and ESPN. Years where the official margin is recorded in laps rather than seconds are excluded from the long-history chart. The CSVs used for these charts are available here: top 10 closest finishes and all margins 1911 to 2026.

Dr. Randal S. Olson
AI Researcher & Builder
I’ve worked in AI for 15+ years, from academic research to production systems at startups. I’m building things independently for now.