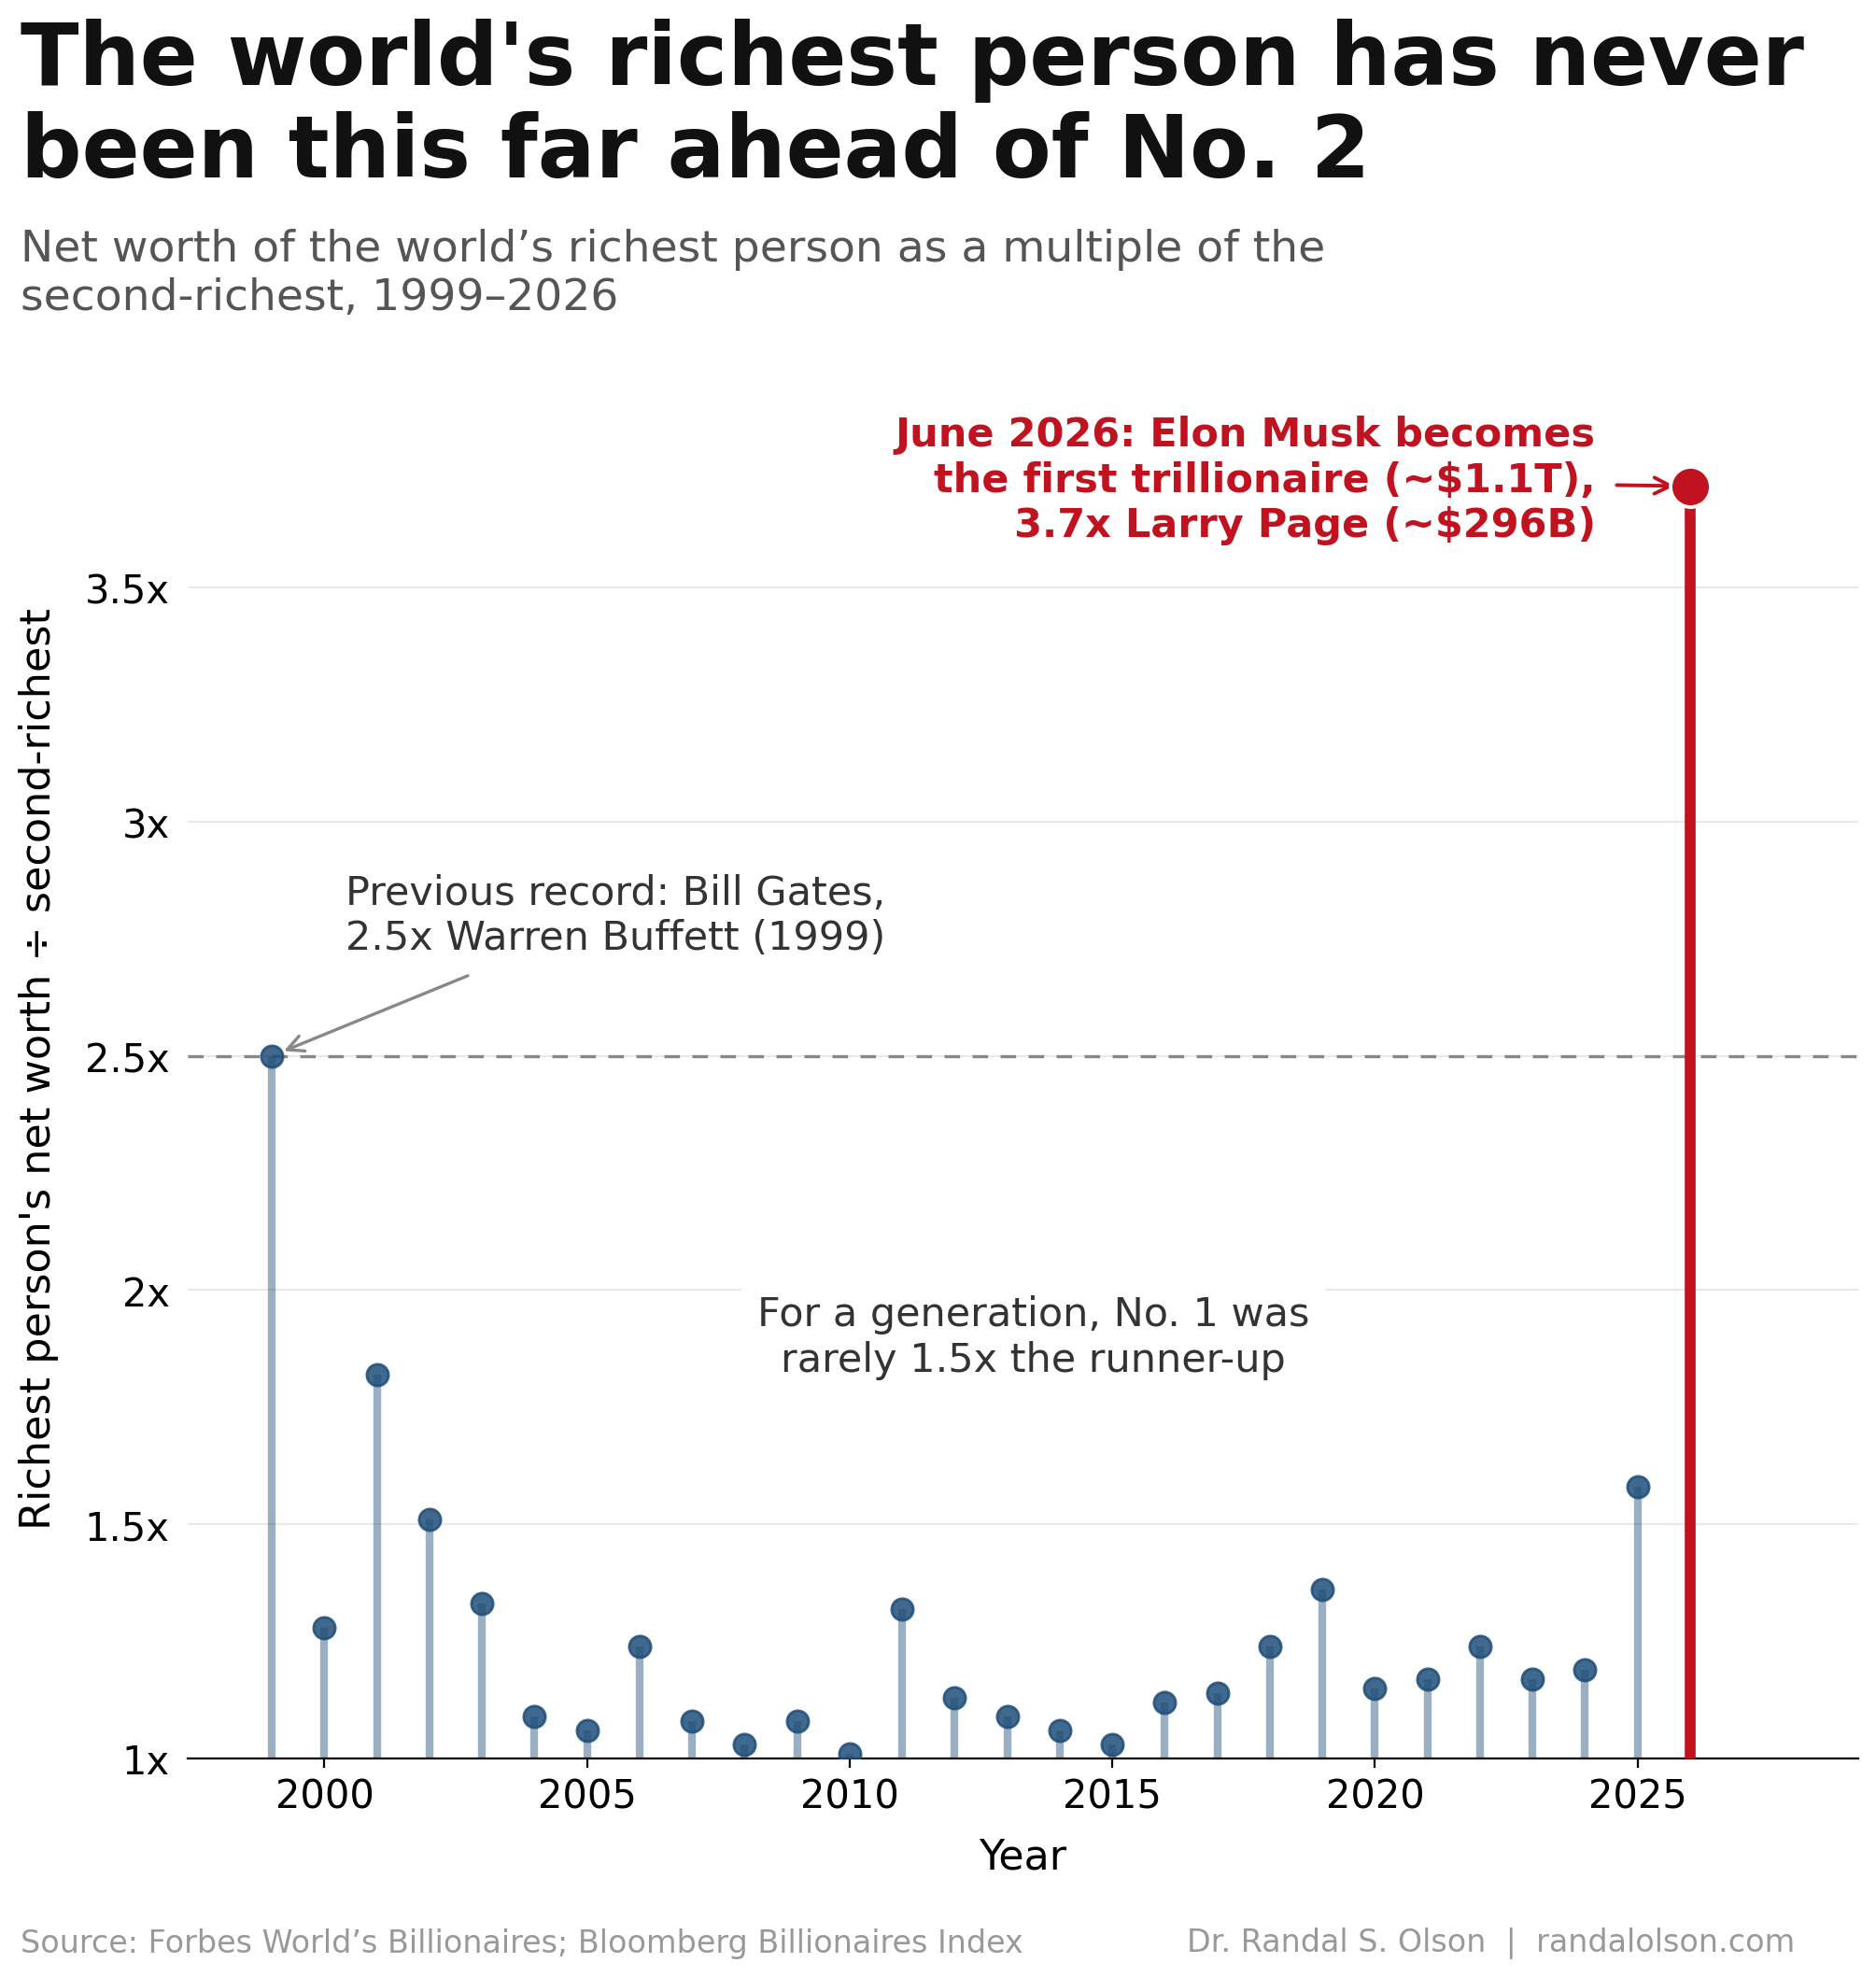
The world's richest person has never been this far ahead of No. 2
Part of Teaching an AI Agent to Make Beautiful Charts
On June 12, Elon Musk became the first person on Earth worth a trillion dollars. The number is hard enough to picture on its own, but the part that really stops you is the distance to everyone else. Musk is now worth more than the next 4 people on the global rich list combined, and for most of the past 25 years the person at No. 1 was barely ahead of No. 2 at all.
Musk crossed a trillion dollars in a single afternoon
The trigger was SpaceX going public. The company priced its shares at $135 and raised about $75 billion, the largest IPO in history, easily clearing the $25.6 billion Saudi Aramco raised in 2019. SpaceX began trading on June 12 at a valuation near $1.77 trillion, and Musk's slice of it was suddenly worth enough to push him past the line.
That made him the world's first trillionaire, at roughly $1.1 trillion. The figure moves around by the day and by whose index you trust, but the milestone held: a single person's paper fortune is now bigger than the annual economic output of all but about 21 countries.
The gap to No. 2 has never been this wide
The chart tracks one simple thing: how many times richer the world's No. 1 is than the No. 2, on the Forbes list each year. For 2026 that ratio is about 3.7. The runner-up, Google co-founder Larry Page, is worth roughly $296 billion, which means the gap between first and second place is around $800 billion, larger than the entire GDP of Ireland.
Put another way, Musk could lose hundreds of billions of dollars and still be the richest person alive. Nothing in the Forbes era looks remotely like it. The No. 1 spot has usually been a tight contest, not a blowout.
For a generation, the race for No. 1 was a photo finish
Look at the stretch from 2000 to 2024 and the dots barely lift off the floor. In a typical year the richest person was only about 1.15 times richer than the runner-up, and the lead almost never reached 1.5x. Whoever held the top spot, whether Gates, Bezos, or Arnault, had someone breathing down their neck.
The closest call came in 2010, when Mexican telecom magnate Carlos Slim edged out Bill Gates for the top spot by just $500 million, $53.5 billion to $53.0 billion. That is 2 of the wealthiest people who have ever lived, separated by a rounding error.
The old record was the dot-com bubble
Before this year, the widest any No. 1 had ever pulled ahead came at the height of the late-1990s tech boom. On the 1999 Forbes list, Bill Gates was worth $90 billion to Warren Buffett's $36 billion, a ratio of exactly 2.5. Microsoft was near its peak and Gates briefly looked untouchable.
Musk's 3.7x lead leaves the dot-com record far behind. Gates held that mark for more than 25 years. Everyone near the top got richer over those decades, but Musk got richer fast enough to pull away from the rest of the field.
How this chart was made
An AI agent built this chart end-to-end as part of the Beautiful Charts with AI series. It pulled the year-by-year No. 1 and No. 2 fortunes from the Forbes annual list, computed the ratio, built the chart in Python, and iterated on the design until it passed the Tufte Test, a data visualization quality standard from Goodeye Labs. The workflow behind it is public: run the same high-signal chart workflow to make your own.
Data source: net worth of the world's first- and second-richest people from the annual Forbes World's Billionaires list, with the live June 2026 figures from the Bloomberg Billionaires Index and cross-checked against reporting on the SpaceX IPO. The dataset used for this chart is available here.
Beautiful Charts with AI
Make your own charts with the same workflow
Every chart in this series is built by the same public workflow. Fork it and run it yourself, then grade the result against the Tufte Test.

Dr. Randal S. Olson
AI Researcher & Builder · Co-Founder & CTO at Goodeye Labs
I’ve worked in AI for 15+ years. At Goodeye Labs, we build AI products that point frontier models at the business outcomes a team actually cares about.