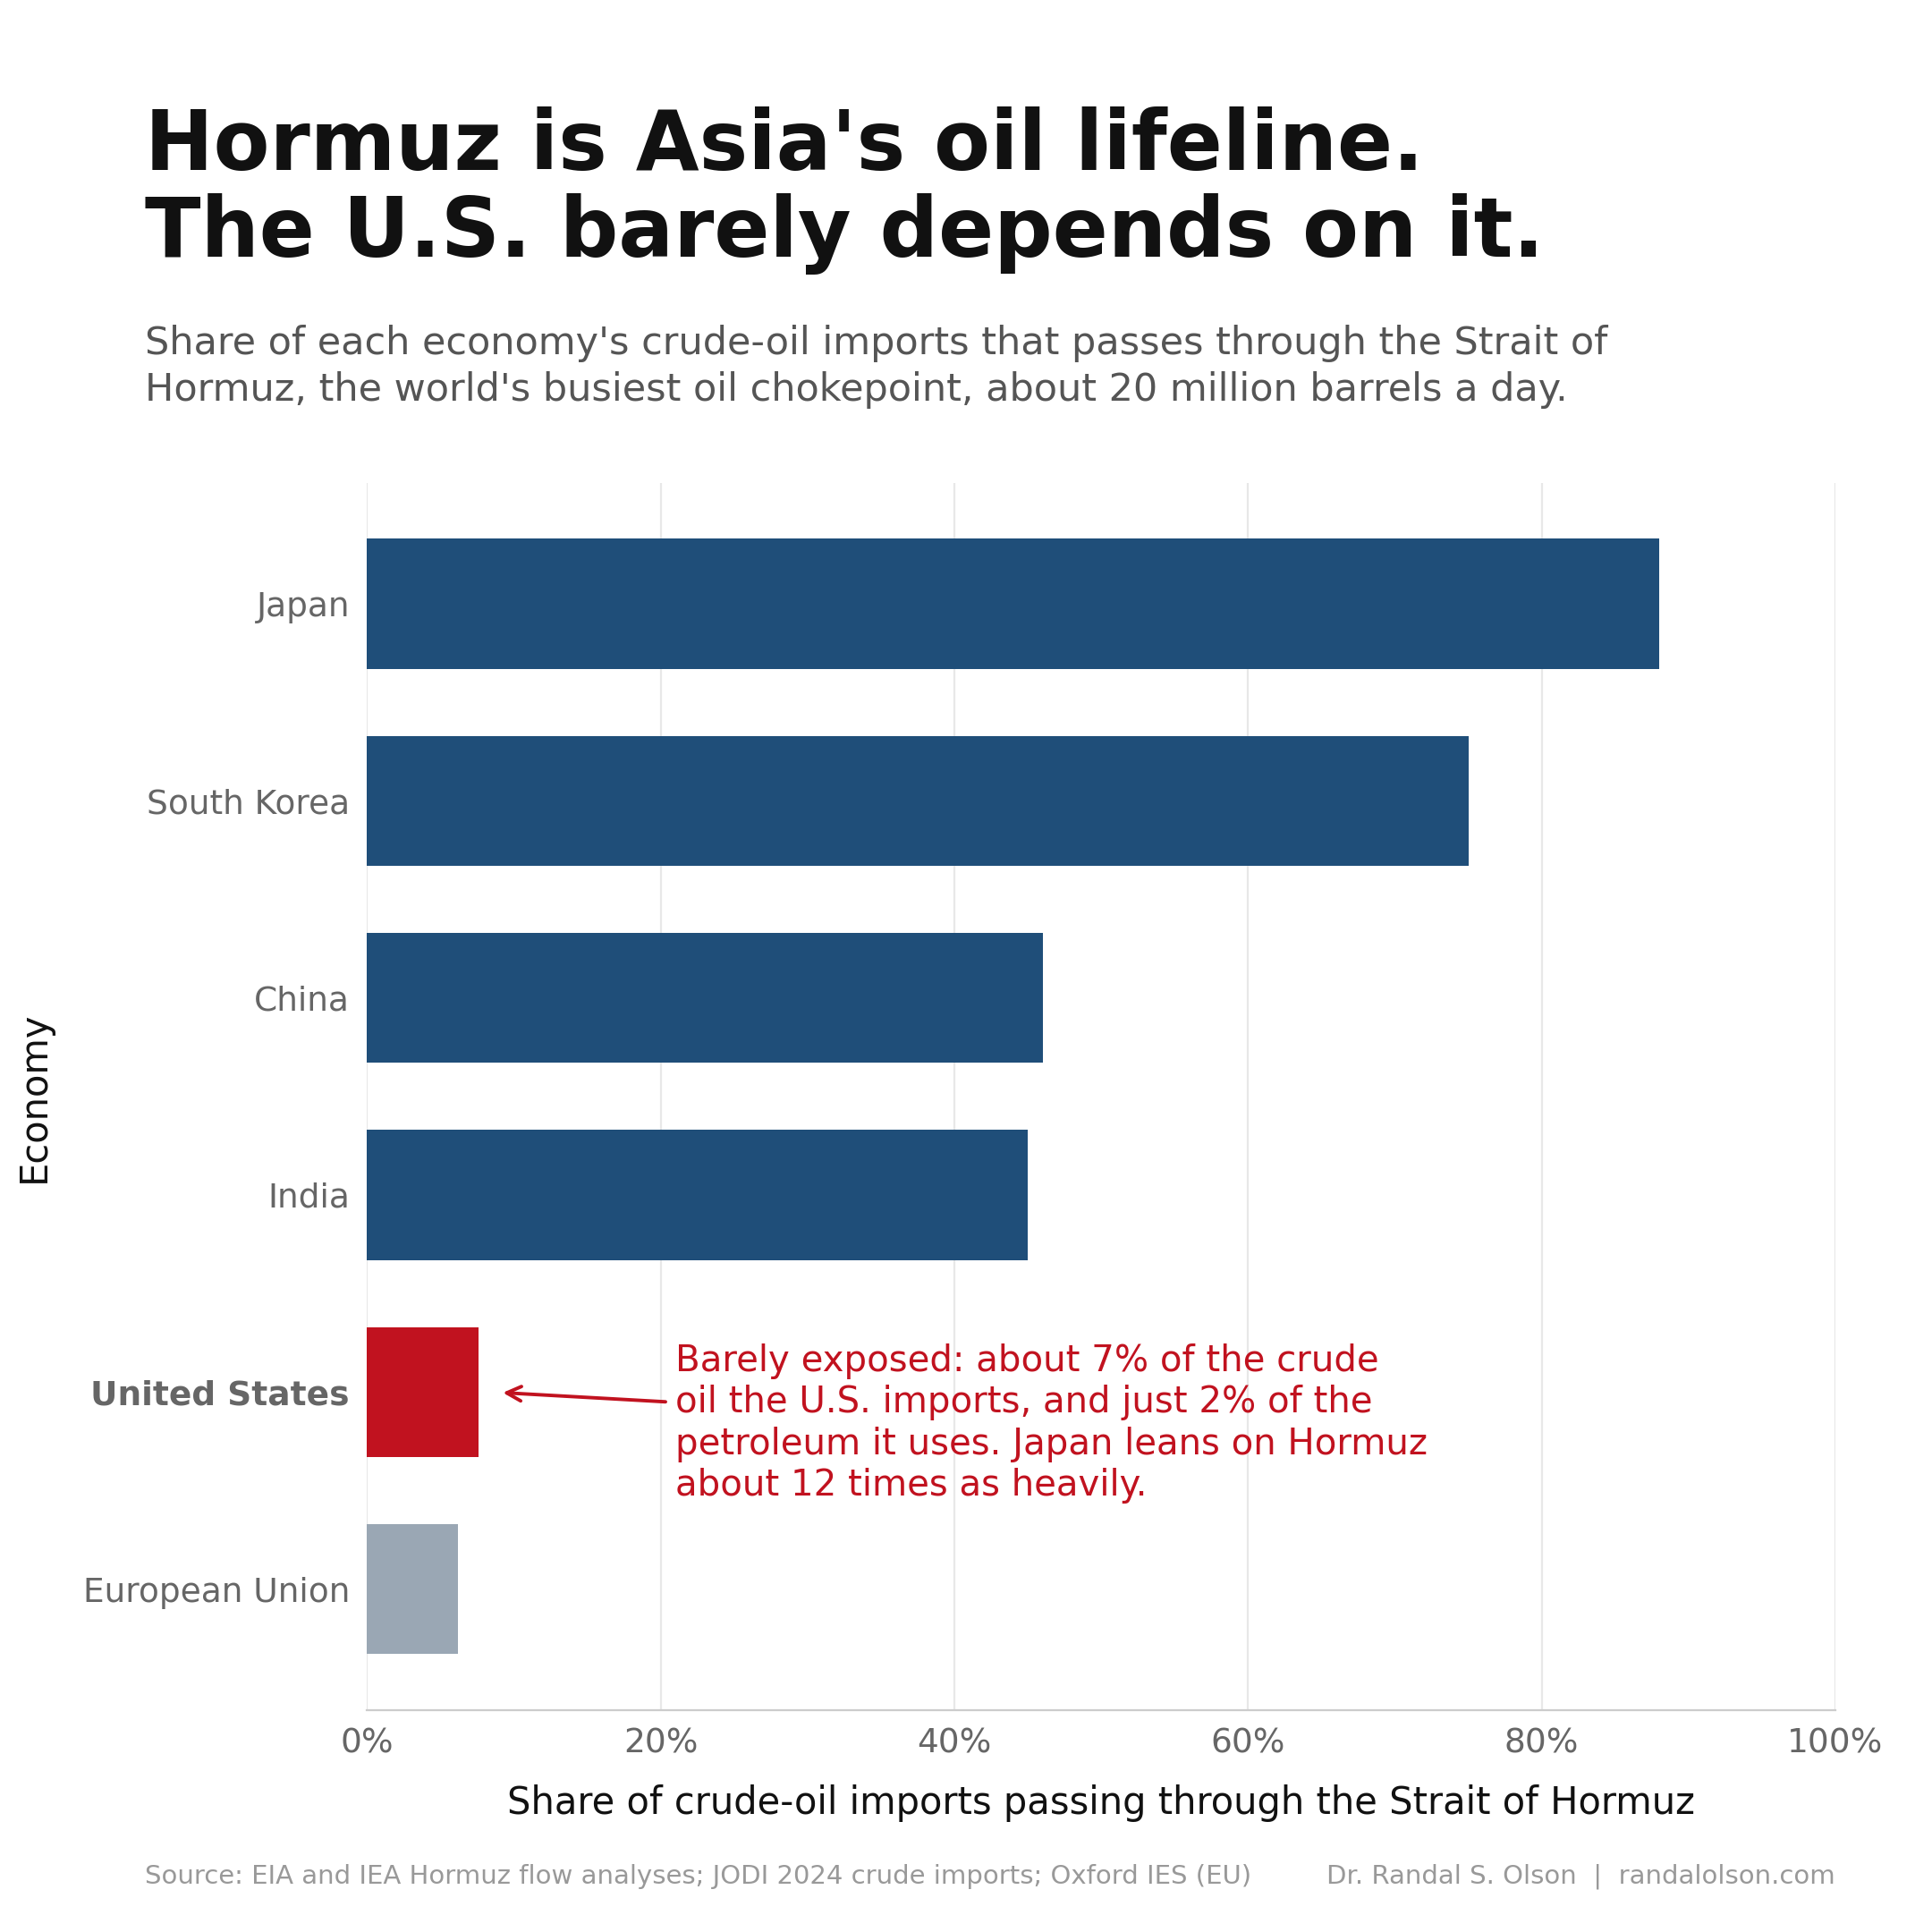
The Strait of Hormuz is Asia's oil lifeline, not the U.S.'s
Part of Teaching an AI Agent to Make Beautiful Charts
When Iran threatened to close the Strait of Hormuz in June 2026, U.S. drivers braced for another gas-price shock and "Hormuz closed" raced up the trending charts. The United States, though, depends on the Strait less than almost any major economy. Roughly 20% of the world's oil passes through that single channel between Iran and Oman, and only a sliver of it is bound for the U.S.
The world's most important oil chokepoint
The Strait of Hormuz is the only sea route out of the Persian Gulf. About 20 million barrels of oil move through it every day, close to 20% of everything the world burns and more than 25% of all the oil that travels by ship, according to the U.S. Energy Information Administration. There is no easy detour: the pipelines built to skirt the Strait can carry only about 2.6 million barrels a day, a fraction of the flow.
When this single waterway gets threatened, the entire oil market flinches. That is why a conflict thousands of miles from any U.S. coastline can still move the price at a gas station in Ohio.
Why the U.S. barely feels it on supply
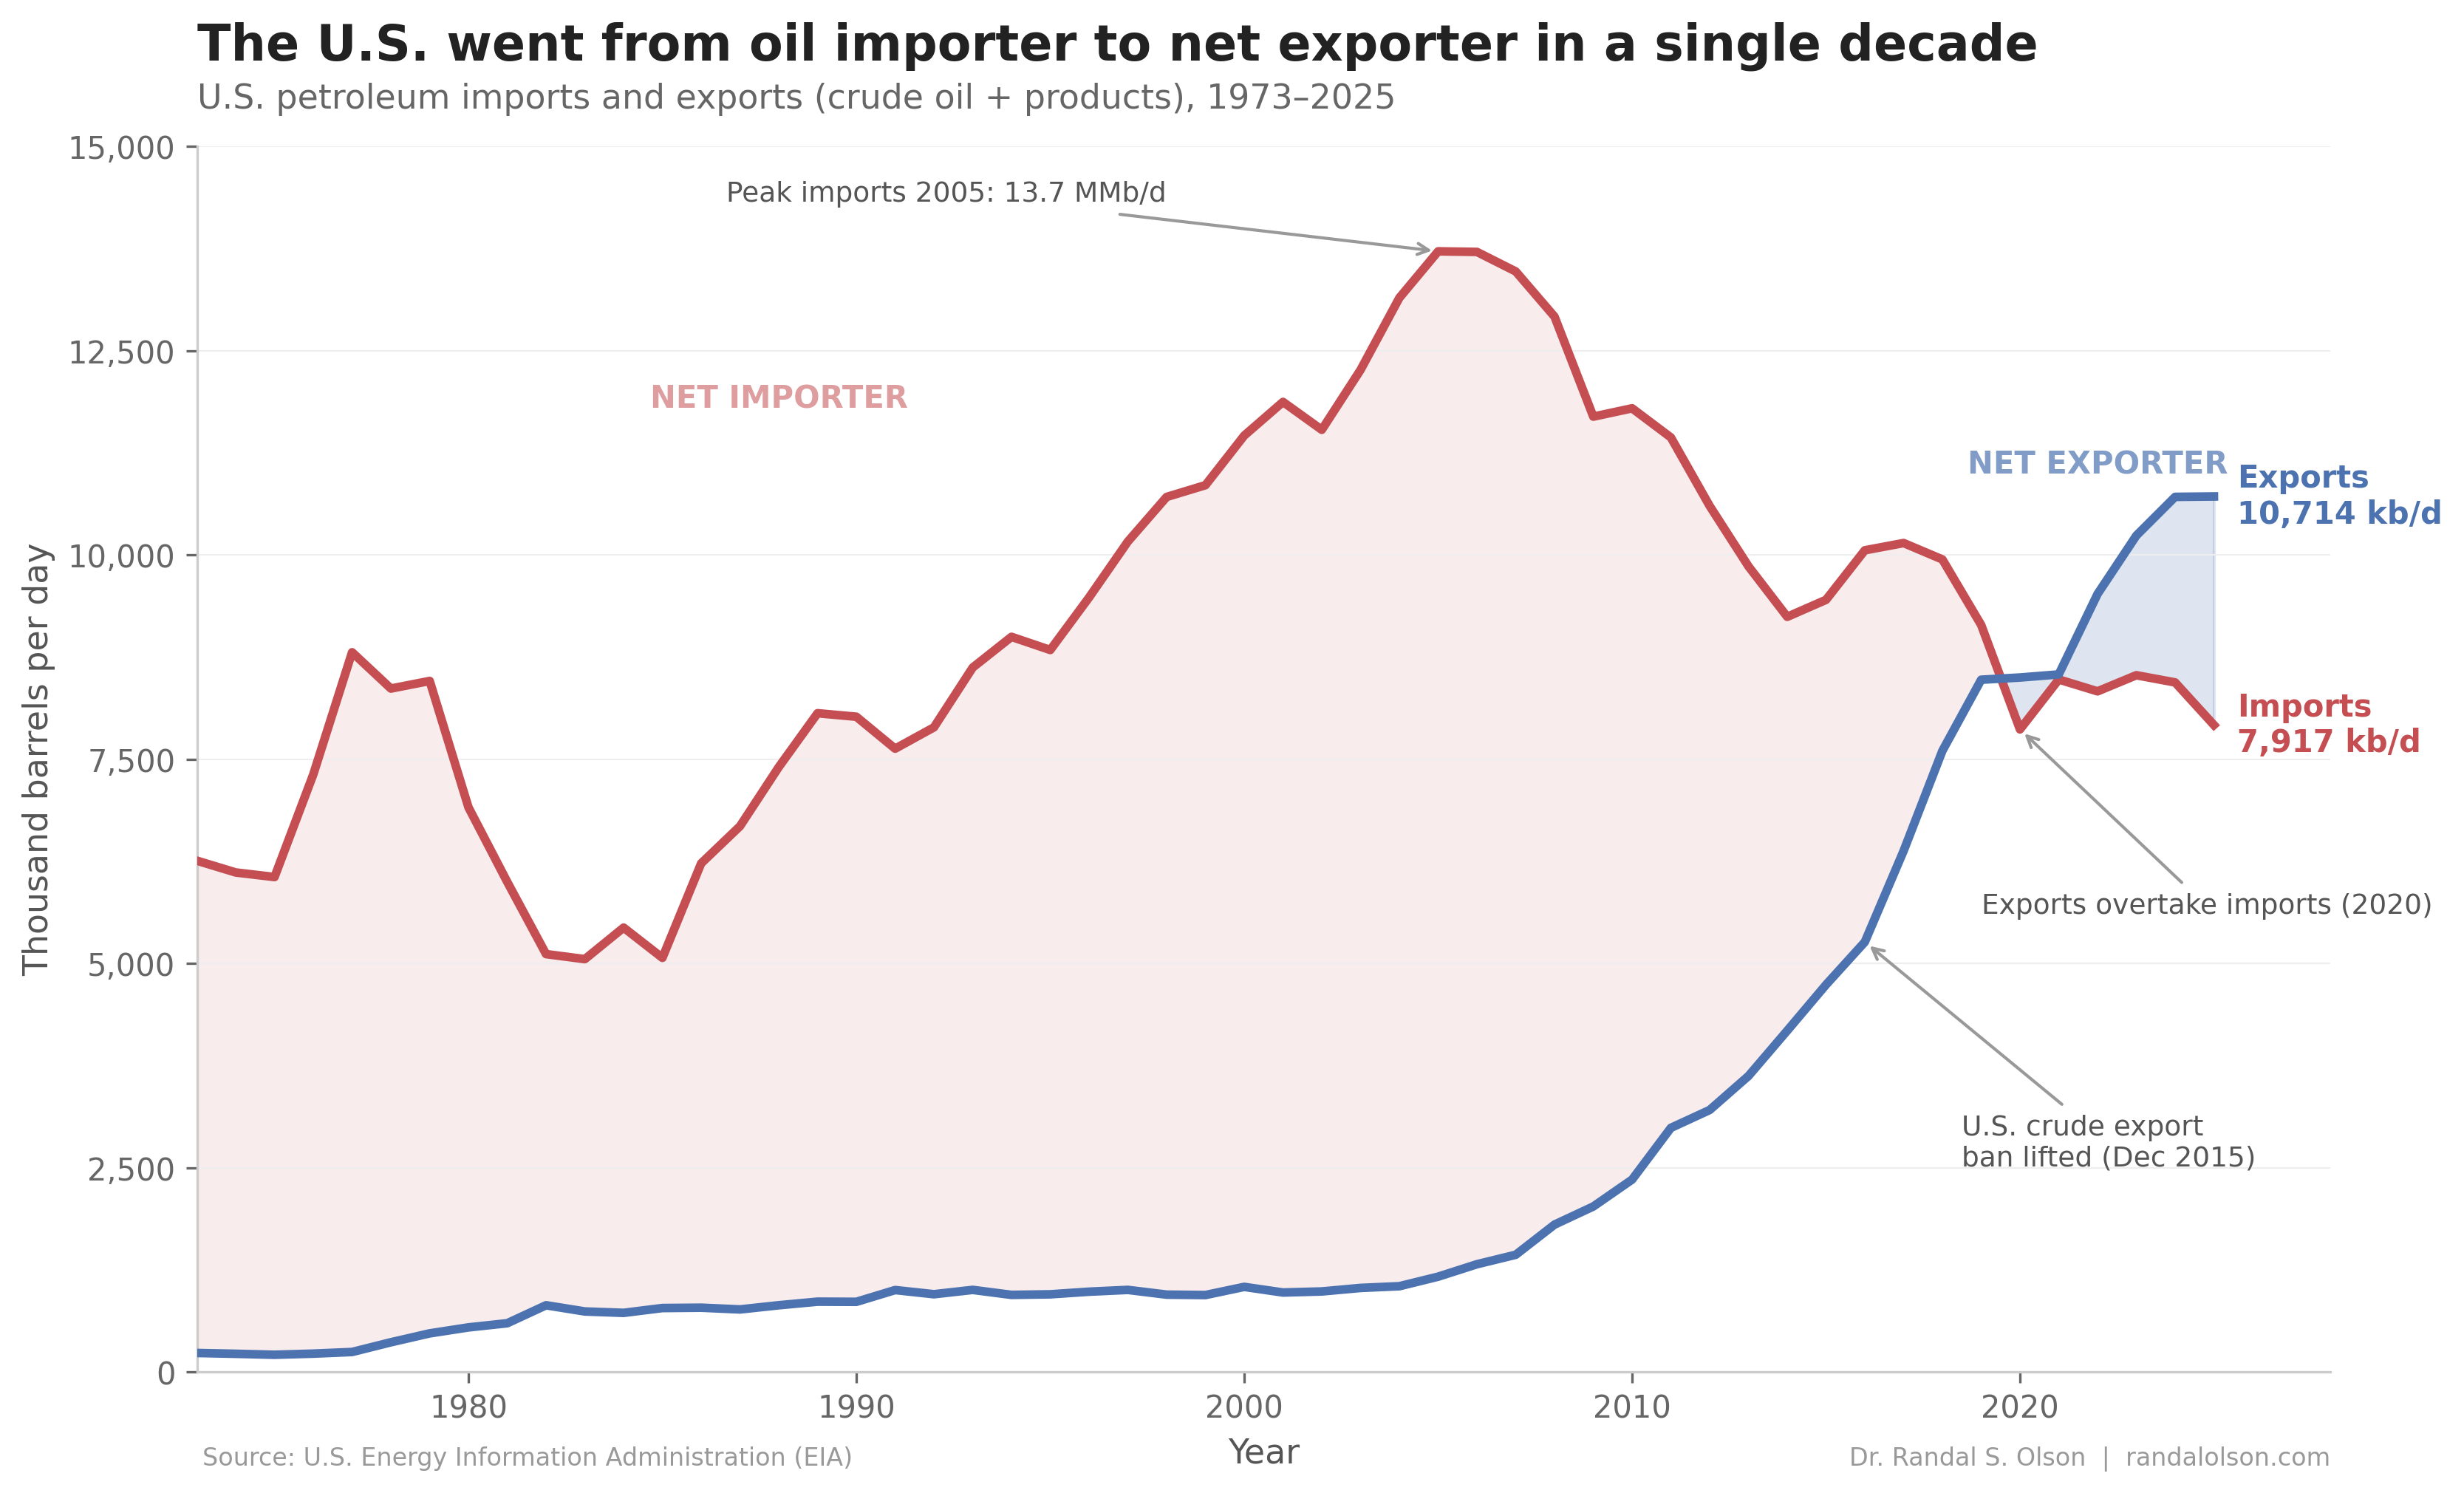
The shale boom rewired where the U.S. gets its oil. The country now produces more crude oil than any nation in history, and in 2020 it became a net exporter of petroleum for the first time since at least 1949. The crude it does buy abroad comes overwhelmingly from next door: Canada sent the U.S. a record 4.1 million barrels a day in 2024, about 62% of the crude the country imports, almost all of it by pipeline, with Mexico and Latin America covering most of the rest.
Only about 7% of U.S. crude imports come through the Strait of Hormuz, and Gulf oil now accounts for just 2% of all the petroleum the U.S. uses, the lowest level in nearly 40 years. The barrels that once tied the U.S. to the Persian Gulf have been replaced by domestic shale and a short pipeline ride from Alberta.
Asia is the economy that actually lives on the Strait
For Asia's big importers, Hormuz is not a headline risk, it is the supply line itself. Japan and South Korea have almost no oil of their own and buy nearly all of it abroad, most of it from the Gulf. In a normal year Japan draws close to 90% of its crude through the Strait and South Korea around 75%, while China and India each rely on it for roughly 45%. Japan leans on Hormuz about 12 times as heavily as the U.S. does.
China is the Strait's single largest customer, taking about 37% of everything that crosses it, and together China, India, Japan, and South Korea account for 69% of all the crude that passes through. That dependence is exactly why those buyers scrambled the moment the Strait looked unsafe. As the 2026 conflict dragged on, Japan lined up crude that skips the Strait entirely, and India leaned harder on non-Hormuz suppliers. The chart shows the normal, peacetime picture. The war pushed Asia to do exactly what the U.S. never had to.
The catch: prices are global even when the barrels aren't
Oil is a global, fungible commodity, so a supply disruption anywhere lifts the price everywhere. Crude is the single biggest component of what U.S. drivers pay at the pump, so a Gulf scare still lands at the gas station even when the physical barrels never leave Asia.
Before the worst of the crisis eased, the EIA expected Brent crude to peak near $115 a barrel and U.S. gasoline near $4.30 a gallon, and analysts warned a prolonged closure could push prices sharply higher. The U.S. is shielded from a supply cutoff, not from the price spike a Hormuz crisis sends around the world.
Why the Strait has never actually closed
For all the threats, the Strait of Hormuz has never been fully shut, not even during the 1980s "Tanker War," when Iran and Iraq launched more than 450 attacks on shipping and the oil kept moving. Part of the reason is that Iran needs the Strait too: nearly all of its own oil leaves through the same channel, and even during the 2026 conflict it kept exporting, sending about 11.7 million barrels to China through Hormuz.
Closing Hormuz would choke Iran's own oil lifeline along with everyone else's, which is why the threat keeps coming back but the shutdown never quite arrives. The U.S. Navy's Fifth Fleet has guarded the waterway from its base in Bahrain for decades, and the world's spare bypass pipelines could move only a small fraction of what the Strait carries.
So the cycle runs the same way each time: a threat, a price spike, a wave of headlines, and then the tankers keep sailing. The oil that crosses Hormuz was never really headed for the U.S. anyway. It is Asia that depends on this Strait, and Asia that has the most to lose on the rare day it ever truly closes.
How this chart was made
An AI agent built this chart end-to-end as part of the Beautiful Charts with AI series. It pulled the Strait of Hormuz flow data from the U.S. Energy Information Administration and the IEA, divided each economy's Hormuz crude by its total crude imports to get a dependence share, built the chart in Python, and iterated on the design until it passed the Tufte Test, a data visualization quality standard from Goodeye Labs. The workflow behind it is public: run the same high-signal chart workflow to make your own.
Data source: Strait of Hormuz crude flows from the U.S. Energy Information Administration (Today in Energy, drawing on Vortexa tanker tracking) and the IEA, with each economy's total crude oil imports from the JODI Oil World Database for 2024, and the European Union dependence figure from the Oxford Institute for Energy Studies. The dataset used for this chart is available here.
Beautiful Charts with AI
Make your own charts with the same workflow
Every chart in this series is built by the same public workflow. Fork it and run it yourself, then grade the result against the Tufte Test.

Dr. Randal S. Olson
AI Researcher & Builder · Co-Founder & CTO at Goodeye Labs
I’ve worked in AI for 15+ years. At Goodeye Labs, we build AI products that point frontier models at the business outcomes a team actually cares about.