Gas prices feel like a record in 2026. Adjusted for inflation, they are not
Part of Teaching an AI Agent to Make Beautiful Charts
Gas is the most expensive it has been in years, the war headlines are everywhere, and "record gas prices" is back in everyone's feed. The pump number stings. But adjust for inflation and the "record" evaporates: U.S. gas cost more in 1981, more in 2008, and more in 2022 than it does today. The number on the pump is near an all-time high. What a gallon actually costs you, in real money, is nowhere near it.
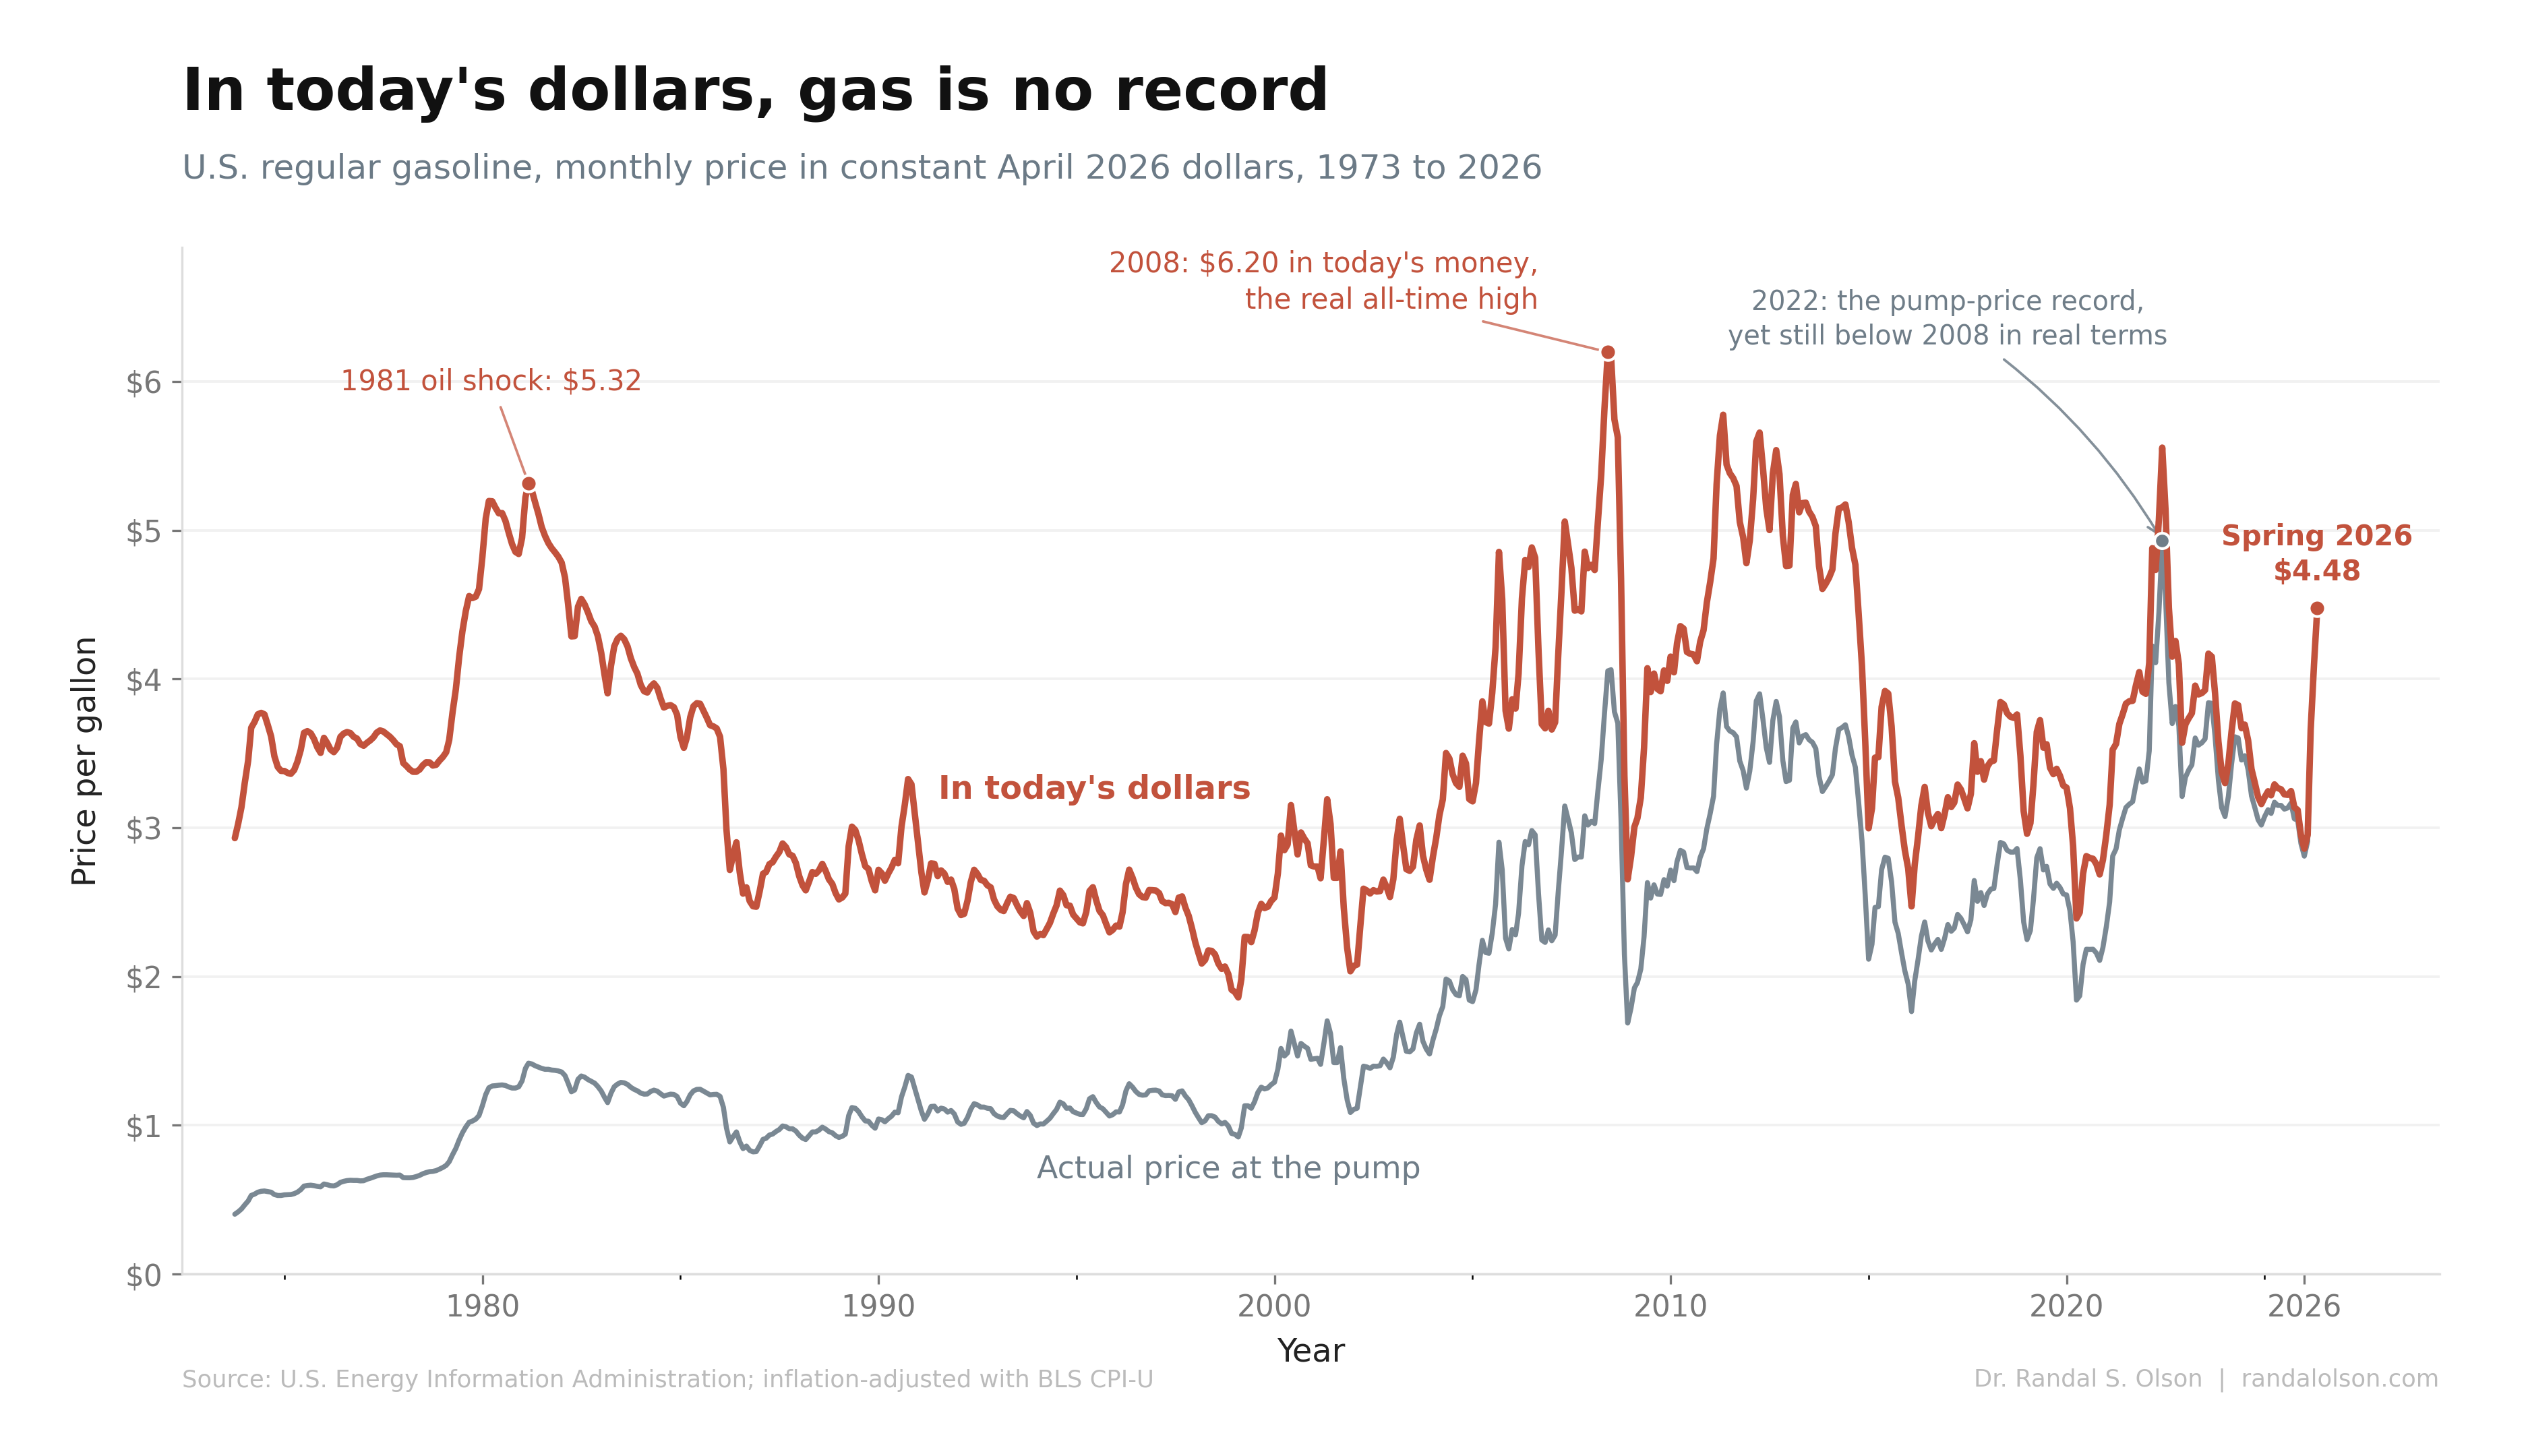
The red line is what a gallon actually costs once every year is put in today's dollars. The gray line is the price you literally hand over at the pump, near its all-time high. The space between them is inflation, and it is the whole story.
The fastest climb since 2022
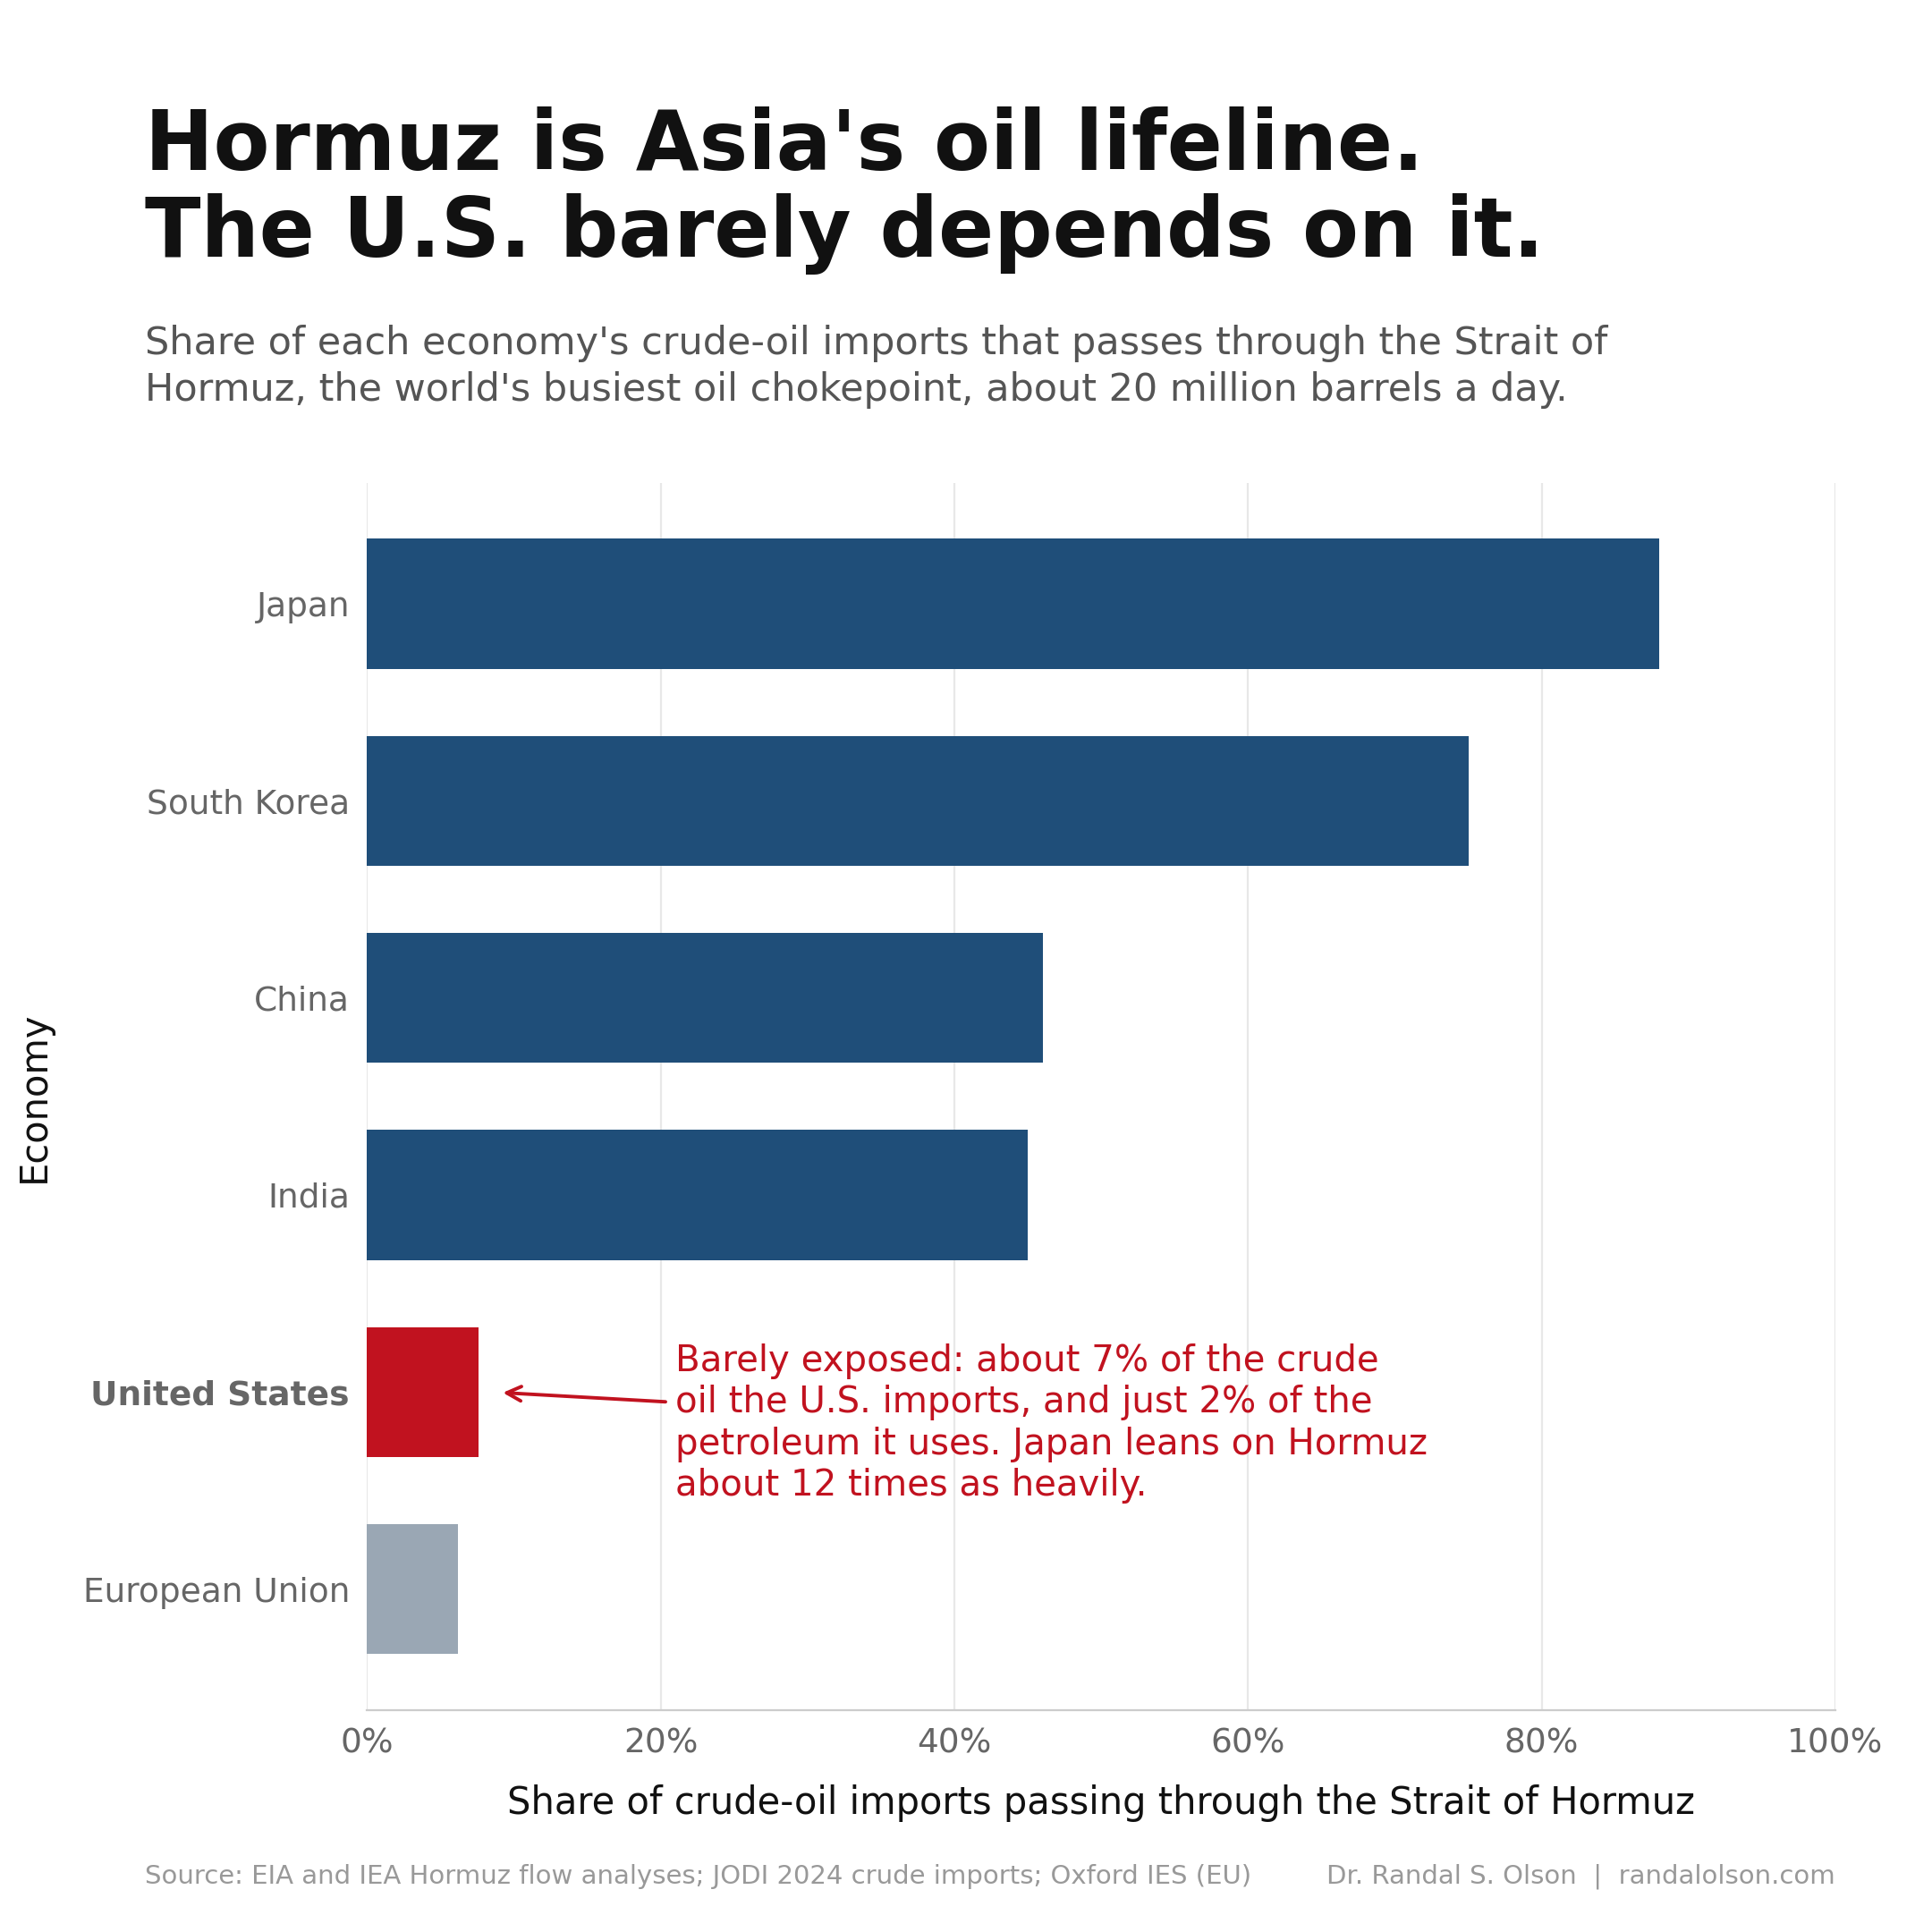
The run-up is real. U.S. regular gas went from $2.81 in January 2026 to $4.48 in May, a 59% jump in 4 months. The trigger was the war between Iran and a U.S.-Israel coalition, and Iran's closure of the Strait of Hormuz, the chokepoint that carries about 20% of the world's oil. Prices have since eased to around $4.30 as a fragile ceasefire holds.
A jump that fast in a single spring is the kind of move that makes people reach for the word "record." It just is not one.
2008 is still the one to beat
The real all-time high was June 2008, at $6.20 a gallon in today's money. Crude oil hit $147.27 a barrel on July 11, 2008, pushed there by surging Chinese demand, a weak dollar, and heavy financial speculation. The pump price peaked just over $4 a gallon, which sounds close to today until you account for 2 decades of inflation. That is $1.72 a gallon more than spring 2026.
1981 was worse too
1981 held the record before 2008 took it. In March 1981, regular gas hit $5.32 a gallon in today's dollars. The Iranian Revolution had cut Iran's output from 6 million barrels a day to about 1.5 million, the squeeze behind the 1979 gas lines, and the Iran-Iraq war that followed kept prices climbing. For 27 years, no oil shock topped it.
Even 2022 cost more
The most recent peak is the one people remember best. When Russia invaded Ukraine, the national average set an all-time record just above $5.00 a gallon in June 2022, per AAA. That was the highest price ever at the pump in plain dollars. Adjust it for inflation and it works out to about $5.55, still above spring 2026 and still short of 2008.
Expensive, just not historic
None of this means gas is cheap. Today's price is higher, in real terms, than 83% of the months since 1973. Only 14 of the last 54 years had even a single month that cost more. The early 2010s are the clearest case: gas held above where it sits today for nearly 4 years straight, from 2011 into 2014, a slow grind rather than a spike.
So both things are true at once: gas really is expensive right now, and it is nowhere near a record. Even if the pump reaches $5 this summer, as some forecasters warn, that would land around the 1981 line, not the 2008 one.
How this chart was made
This chart was built by an AI agent and graded against the Tufte Test, a data visualization quality standard from Goodeye Labs. The workflow behind it is public: run the same high-signal chart workflow to make your own.
Data source: Retail gasoline prices from the U.S. Energy Information Administration (national regular gasoline, with the pre-1990 tail from the EIA Monthly Energy Review, Table 9.4), adjusted for inflation with the Bureau of Labor Statistics CPI-U. The cleaned dataset is available here.
Beautiful Charts with AI
Make your own charts with the same workflow
Every chart in this series is built by the same public workflow. Fork it and run it yourself, then grade the result against the Tufte Test.

Dr. Randal S. Olson
AI Researcher & Builder · Co-Founder & CTO at Goodeye Labs
I’ve worked in AI for 15+ years. At Goodeye Labs, we build AI products that point frontier models at the business outcomes a team actually cares about.