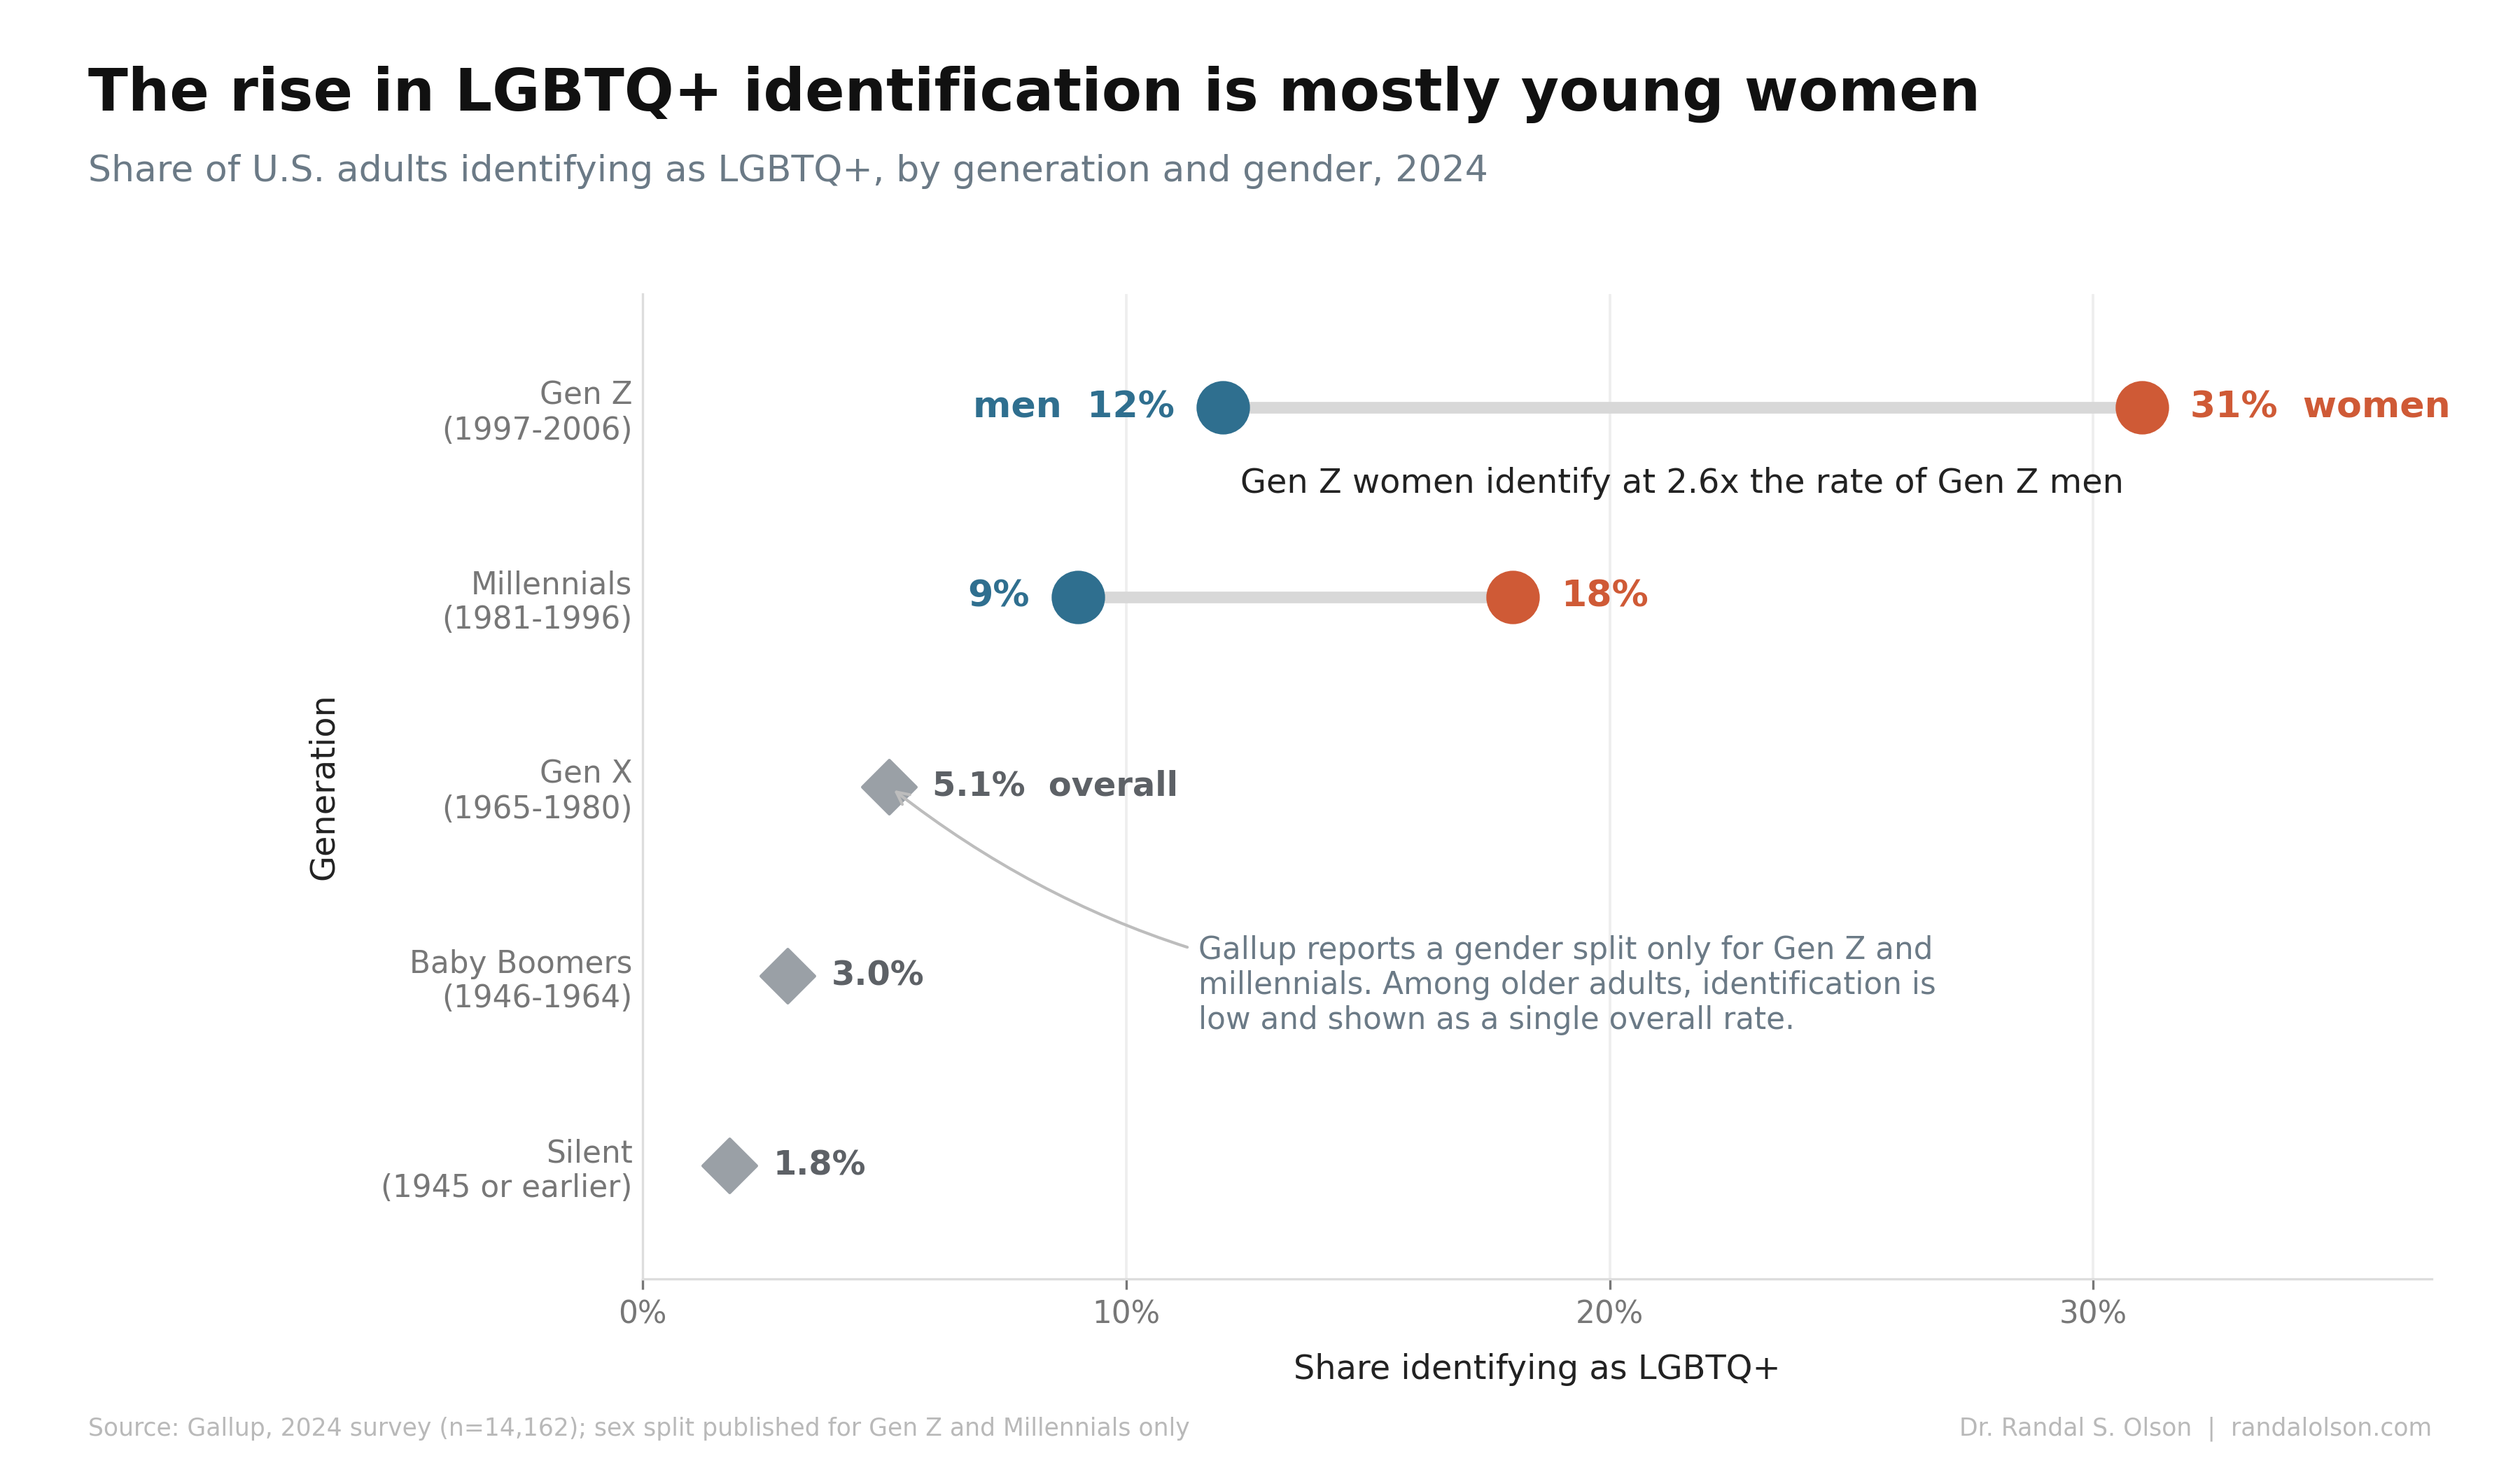
The rise in LGBTQ+ identification is mostly young women
Part of Teaching an AI Agent to Make Beautiful Charts
You have probably seen the headline: Gen Z is far more likely to identify as LGBTQ+ than any generation before it. That much is true. But it flattens a more specific story. The rise is not spread evenly across young people. It is concentrated among young women, and most of it runs through bisexuality, often quietly enough that the people around them might not know.
Gallup has tracked this in the U.S. since 2012. Its 2024 survey of more than 14,000 adults is the most recent one that splits identification by both generation and gender, and the split is where the real story lives.
The chart is really a timeline of acceptance
Read it from the bottom up and you are watching a country change its mind. The Silent Generation came of age when homosexuality was officially classified as a mental illness, a label that stood until 1973. Gen Z came of age after the Supreme Court made same-sex marriage a settled right. Almost nobody in the oldest group says they are LGBTQ+. Nearly 1 in 4 of the youngest does.
That climb tracks the country's own turn. Support for same-sex marriage went from 27% in 1996 to 70% by 2021. As acceptance rose, the cost of saying it out loud dropped, and more people said it. The line is steep because the change was fast, and each generation grew up in a more accepting version of the same country.
It's young women, not just young people
Split the youngest generations by gender and the tidy "kids these days" framing falls apart. Among Gen Z, 31% of women identify as LGBTQ+, against 12% of men. The same gap shows up for millennials and fades with age. What everyone files under youth is, to a large degree, a shift among young women.
The honest answer to why is that nobody is sure yet. Psychologist Lisa Diamond's research argues that women's sexuality tends to be more fluid over a lifetime, and Pew finds 16% of women under 30 call themselves bisexual, against 5% of men. I went in hoping for a clean explanation and came out without one, which is its own kind of finding.
Most of it is bisexuality, and most of it is quiet
There is another layer under the gender gap. The label doing most of the work is bisexual. Among LGBTQ+ members of Gen Z, most are bisexual; among the oldest LGBTQ+ adults, almost none are. Older generations are mostly gay and lesbian. Younger ones are mostly bi.
Bisexuality is also the least visible part of the spectrum. Most bisexual adults with a partner are with someone of a different sex, and most are not out to the people who matter to them. So a lot of this rise is not a parade. It is often a woman in a relationship with a man, answering a survey question differently than she would have a decade ago.
The gap is a forecast
The overall number recently stopped rising. It has held near 9% for 2 years, which Gallup calls essentially unchanged. It is tempting to read that as the trend topping out.
But a generation gap this wide is less a snapshot than a forecast. As the Silent Generation gives way to Gen Z, the national share keeps climbing on its own, with nobody changing their mind. The country's LGBTQ+ population is growing less because adults are rethinking who they are and more because of who is aging out and who is coming up.
How this chart was made
An AI agent built this chart end-to-end as part of the Beautiful Charts with AI series. It researched the data, built the chart in Python, and iterated on the design until it passed the Tufte Test, a data visualization quality standard from Goodeye Labs. The workflow behind it is public: run the same high-signal chart workflow to make your own.
Data source: Gallup's annual LGBTQ+ identification survey, specifically the 2024 release (the most recent year Gallup breaks identification out by both generation and gender) and the 2025 update. The dataset used for this chart is available here.
Beautiful Charts with AI
Make your own charts with the same workflow
Every chart in this series is built by the same public workflow. Fork it and run it yourself, then grade the result against the Tufte Test.

Dr. Randal S. Olson
AI Researcher & Builder · Co-Founder & CTO at Goodeye Labs
I’ve worked in AI for 15+ years. At Goodeye Labs, we build AI products that point frontier models at the business outcomes a team actually cares about.